
Q4 2021: Sector Analysis
The Jiggy Capital Newsletter #6

Link to read newsletter outside of email
Overview
For this first newsletter of Q4 2021, I’m going to be doing my second edition of Sector Analysis (I think this is a better description than Sector Screens). This will be highlighting 14 different sectors using two sets of criteria:
2021-2023 Projected Revenue CAGR vs. Enterprise Value / 2022 Expected Gross Profit (EV/2022 GP)
2021-2023 Projected Revenue CAGR vs. Enterprise Value / 2022 Expected EBITDA (EV/2022 EBITDA)
I’ll also be adding another wrinkle to this from last time on top of the EBITDA multiple analysis addition where the scatter plot dots will have a color code:
Green = Company is EBITDA positive in 2021
Orange = Company is projected to be EBITDA positive by 2023
Red = Company is not projected to be EBITDA positive by 2023
I’ll be breaking down each sector into 5 main parts:
Scatter Plots: This will be where the EV/GP and EV/EBITDA scatter plots will be shown. I decided I’m not going to publish the full spreadsheet data this time around since it was so messy last time but I’ll be linking my spreadsheet public to view at the bottom.
Sector Stats: I’ll be highlighting the sectors median 2021-2023 revenue CAGR, gross margins, EV/2022e GP and EV/2022e EBITDA multiples. I’ll use averages for sectors with a dataset under 10 companies.
Sector Highlights: I’ll be highlighting the companies with the strongest and weakest gross margins, EBITDA margins, and 2021-2023 projected revenue CAGR
Scatter Plot Trendline Error Percentage: Using the sector scatter plot generated trendline equation, I look at the biggest discrepancies between their actual EV/2022e GP and EBITDA multiples versus their expected ones.
My Take: A quick one or two sentence take on the output data.
The forward projections are taken from Koyfin average analyst estimates, which I use religiously and think it’s the best free service out there for any company analysis. I also use their Enterprise Value data, and the rest comes from google finance function on google sheets.
The sectors I will be looking at in the newsletter are:
AdTech
Big Tech
Clean Energy
Cloud Infrastructure
eCommerce
Fintech
Food & Drink
Gaming
iGaming
Platform
Real Estate
Retail
Social Media
Software
Before we get started, I want to go over key assumptions:
I’m assuming the financial information gathered is correct - Please let me know if something is off for a company I’d be happy to look into it further and correct it.
I’m assuming with gross profit projections their gross profit margin won’t change - This obviously isn’t reality as margins expand/contract over time as a companies business changes/scales but this is the best I can do (as of now at least).
This was a big reason why I thought the EBITDA multiples addition would be a good idea as I get those direct numbers from Koyfin, whereas with GP projections I use their analyst projected revenue and multiply it by their 2020 gross profit margin.
Gross profit margin is also a metric that can be left for some company interpretation where you can hide some costs elsewhere. This is only one piece of the puzzle and shouldn’t be used as financial advice and taken with a grain of salt.
This is not looking at the quality of a company, management, market position, runway, and even more importantly, quality of revenue profile (recurring vs transaction-based vs one time revenues).
Sector Screens
AdTech
Companies looked at: AcuityAds (ATY), Facebook (FB), Alphabet (GOOG), Magnite (MGNI), Pubmatic (PUBM), Roku (ROKU), The Trade Desk (TTD)
Scatter Plots:
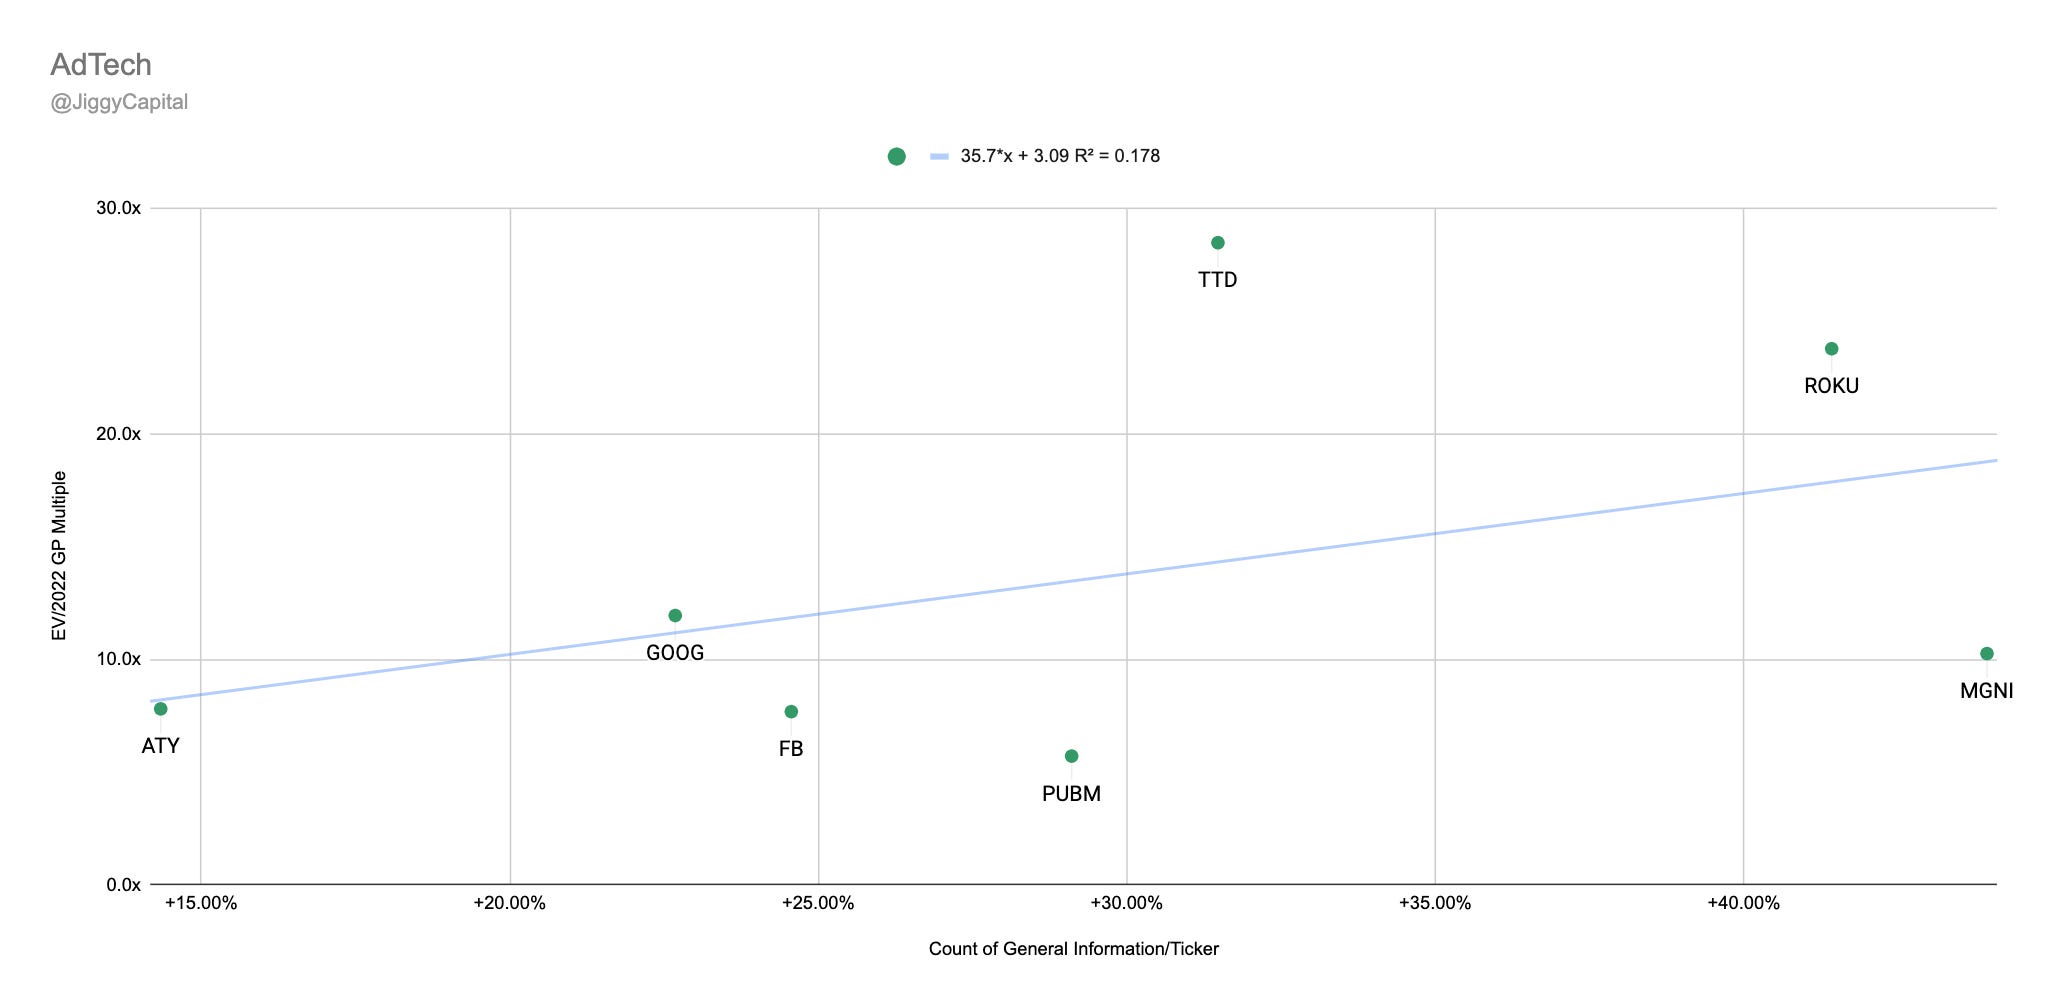
2021-2023 Revenue CAGR vs EV/2022 Gross Profit Multiple:
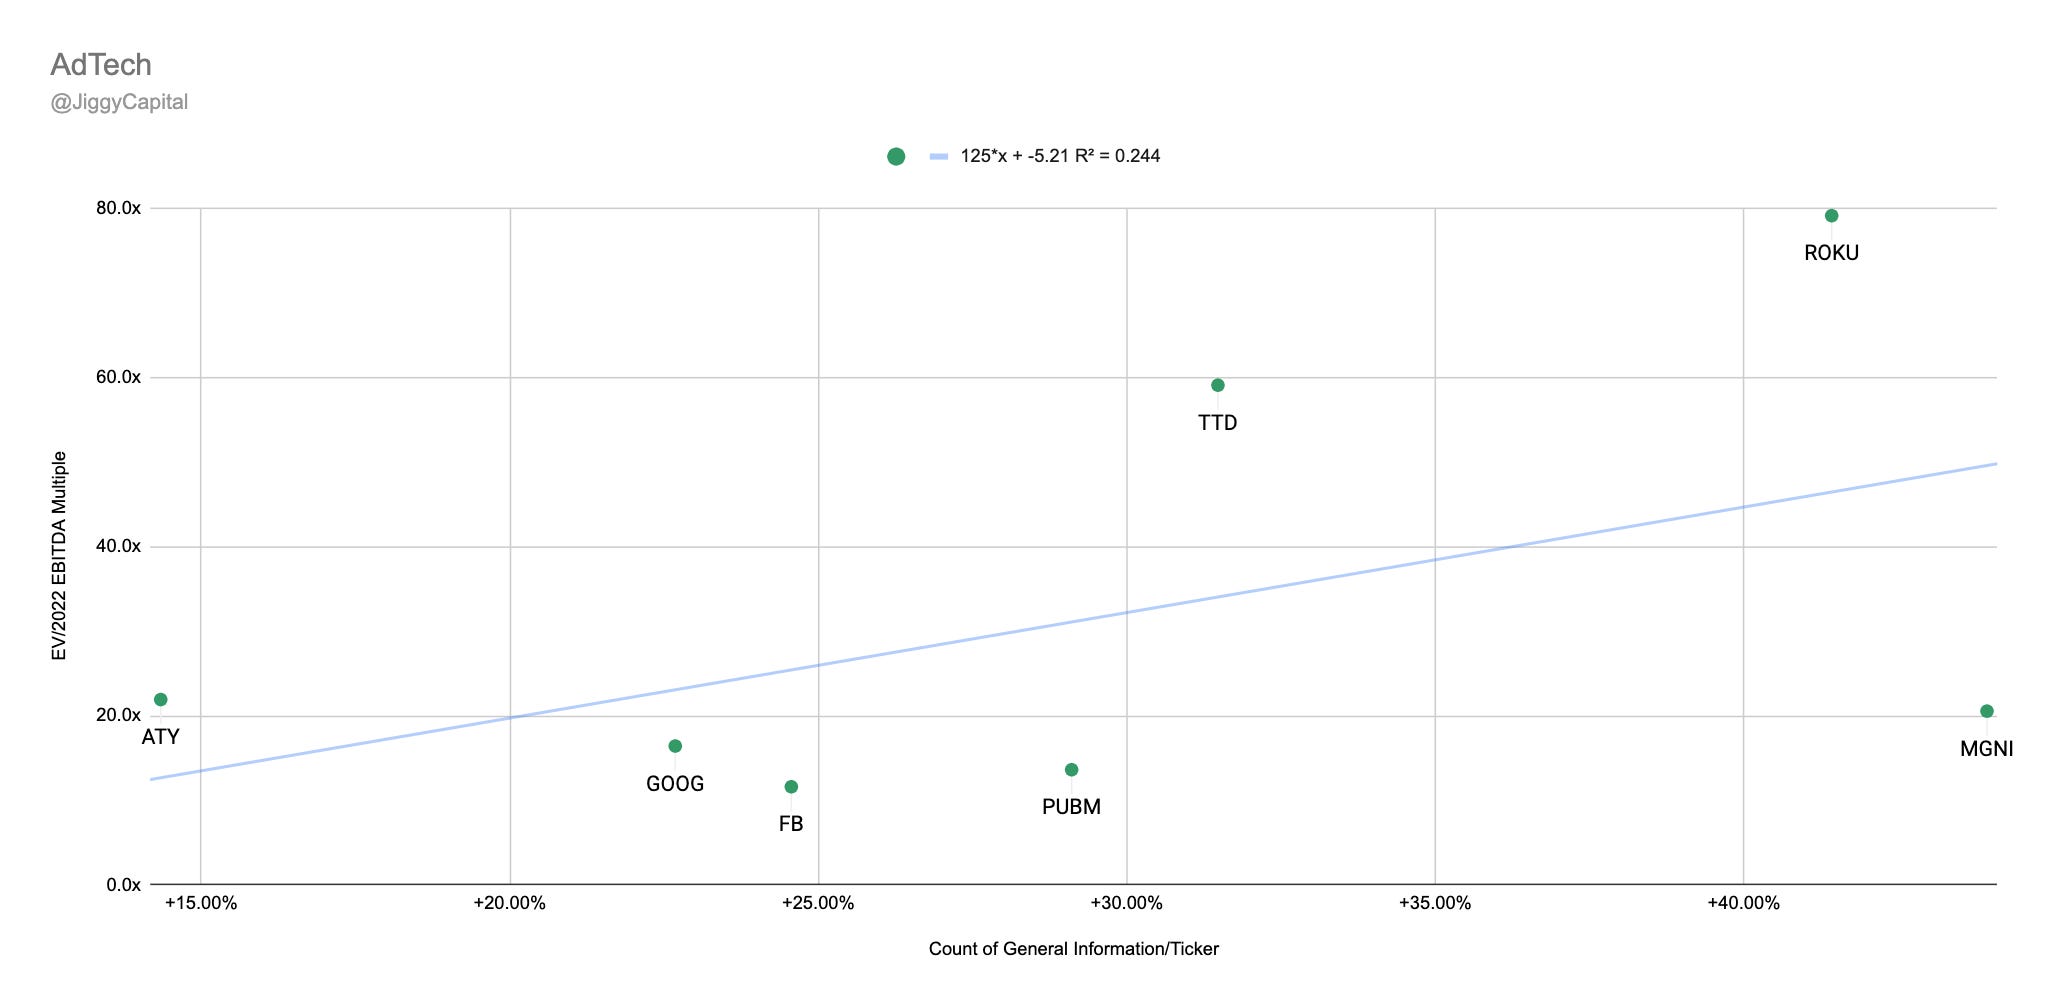
2021-2023 Revenue CAGR vs EV/2022 EBITDA Multiple:
Sector Stats:
Average Gross Margins: 64%
Average 2022e EBITDA Margin: 32%
Average 2021-2023 Projected Revenue CAGR: 30%
Average EV/2022e GP Multiple: 13.4x
Average EV/2022e EBITDA Multiple: 31.1x
Sector Highlights:
Strongest Gross Margins: Facebook (81%)
Strongest 2022e EBITDA Margins: Facebook (53%)
Strongest 2021-2023 Projected Revenue CAGR: Roku (27%)
Weakest Gross Margins: Roku (45%)
Weakest 2022e EBITDA Margins: Roku (14%)
Weakest 2021-2023 Projected Revenue CAGR: AcuityAds (14%)
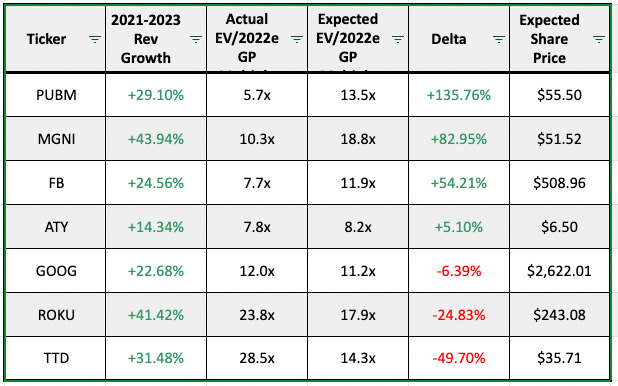
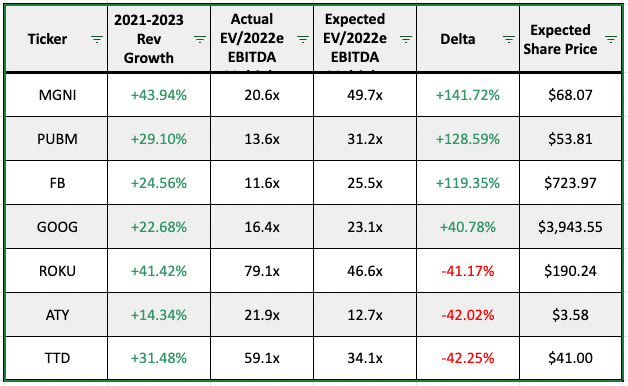
Scatter Plot Trendline Error Percentage:
“Undervalued”:
Gross Profit: Pubmatic (+135% Upside)
EBITDA: Magnite (+141% Upside)
“Overvalued”:
Gross Profit: The Trade Desk (-50% Downside)
EBITDA: The Trade Desk (-42% Downside)
Full Data:
Gross Profit:
EBITDA:
My Take
I think there’s something to be said for all players in this group being EBITDA positive, and there’s no doubt a ton of runway for this group. The leaders trading at a relative premium isn’t that surprising, but ATY looks the worst here IMO.
Big Tech
Companies looked at: Apple (AAPL), Amazon (AMZN), Facebook (FB), Alphabet (GOOG), Microsoft (MSFT)
Scatter Plots:
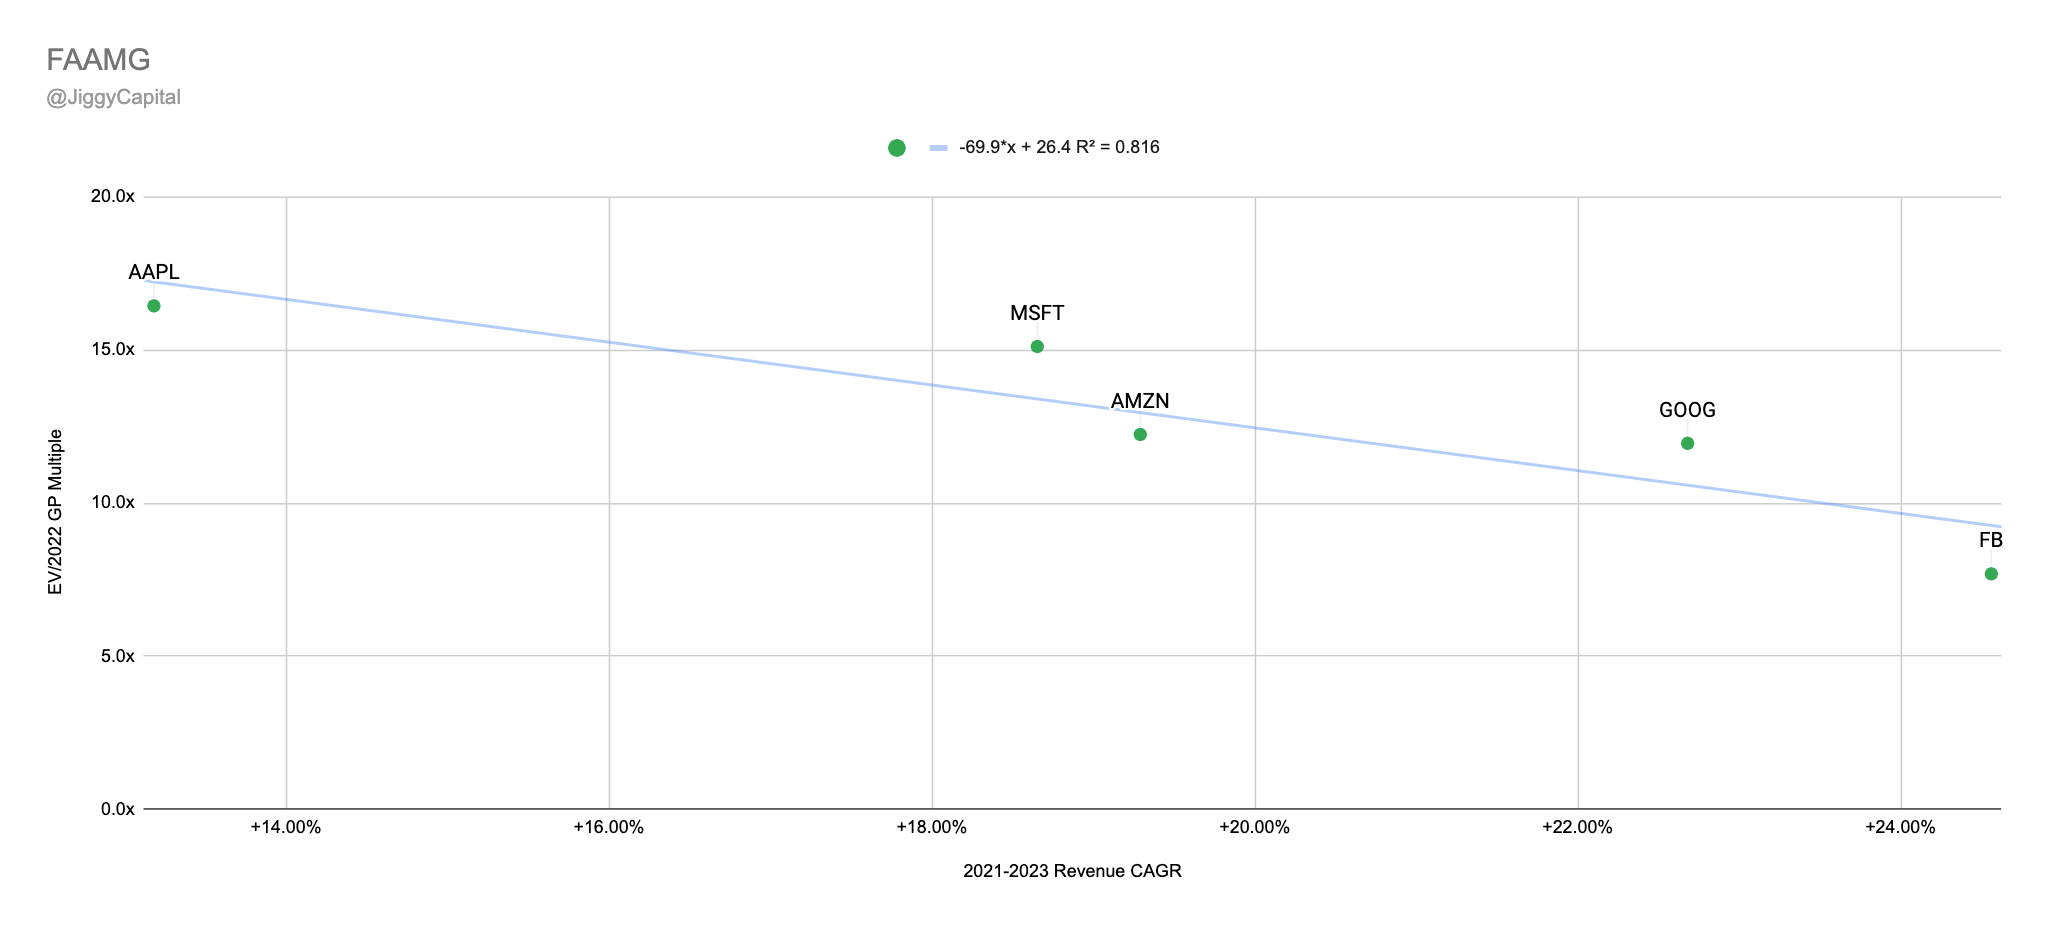
2021-2023 Revenue CAGR vs EV/2022 Gross Profit Multiple:
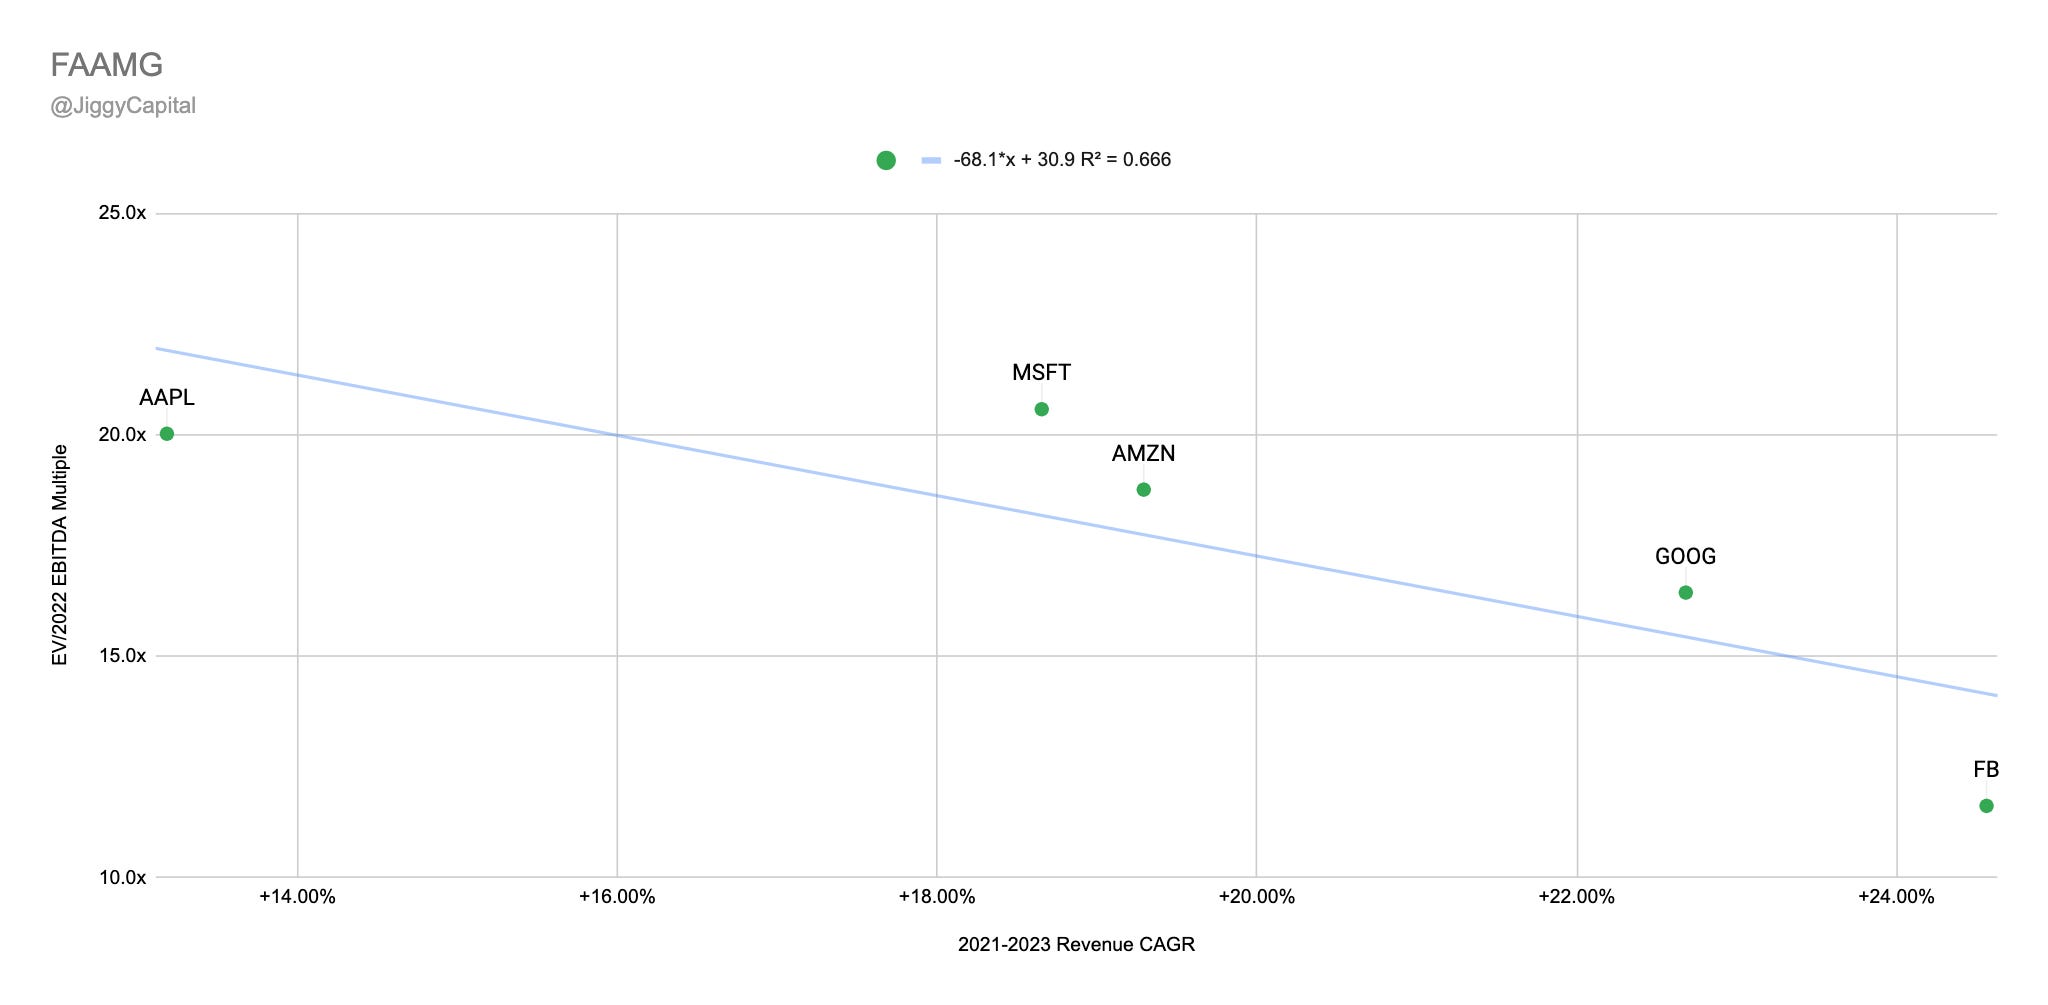
2021-2023 Revenue CAGR vs EV/2022 EBITDA Multiple:
Sector Stats:
Average Gross Margins: 53%
Average 2022e EBITDA Margin: 38%
Average 2021-2023 Projected Revenue CAGR: 20%
Average EV/2022e GP Multiple: 12.6x
Average EV/2022e EBITDA Multiple: 17.4x
Sector Highlights:
Strongest Gross Margins: Facebook (81%)
Strongest 2022e EBITDA Margins: Facebook (53%)
Strongest 2021-2023 Projected Revenue CAGR: Facebook (23%)
Weakest Gross Margins: Amazon (24%)
Weakest 2022e EBITDA Margins: Amazon (16%)
Weakest 2021-2023 Projected Revenue CAGR: Apple (13%)
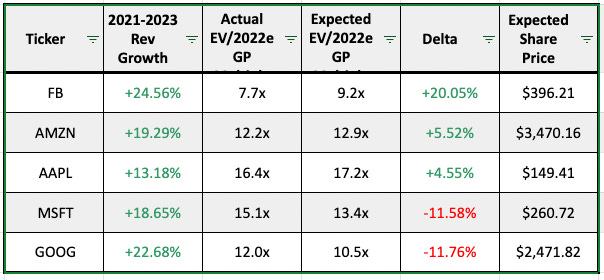
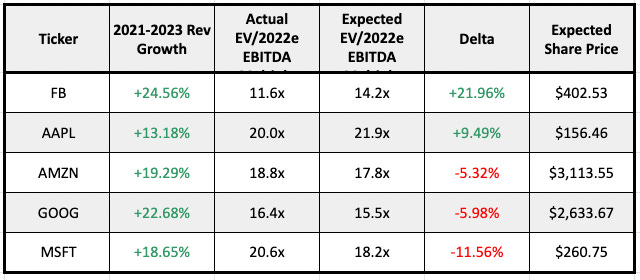
Scatter Plot Trendline Error Percentage:
“Undervalued”:
Gross Profit: Facebook (+20% Upside)
EBITDA: Facebook (+22% Upside)
“Overvalued”:
Gross Profit: Alphabet (-12% Downside)
EBITDA: Microsoft (-12% Downside)
Full Data:
Gross Profit:
EBITDA:
My Take
This is one of two “sectors” where the trendline is all out of whack, meaning that projected growth isn’t the main driver for multiple attached. I wouldn’t look too into this data, other than Facebook has quite a discount built into it safely (which is not news).
Clean Energy
Companies looked at: Bloom Energy (BE), Brookfield Renewable (BEP), Canadian Solar (CSIQ), Clearway Energy (CWEN), Daqo New Energy (DQ), Enphase Energy (ENPH), FuelCell Energy (FCEL), First Solar (FSLR), Honeywell (HON), JinkSolar (JKS), Livent (LTHM), NextEra Energy (NEE), Plug Power (PLUG), Solaredge (SEDG), Sunpower (SPWR), Stem (STEM)
Scatter Plots:
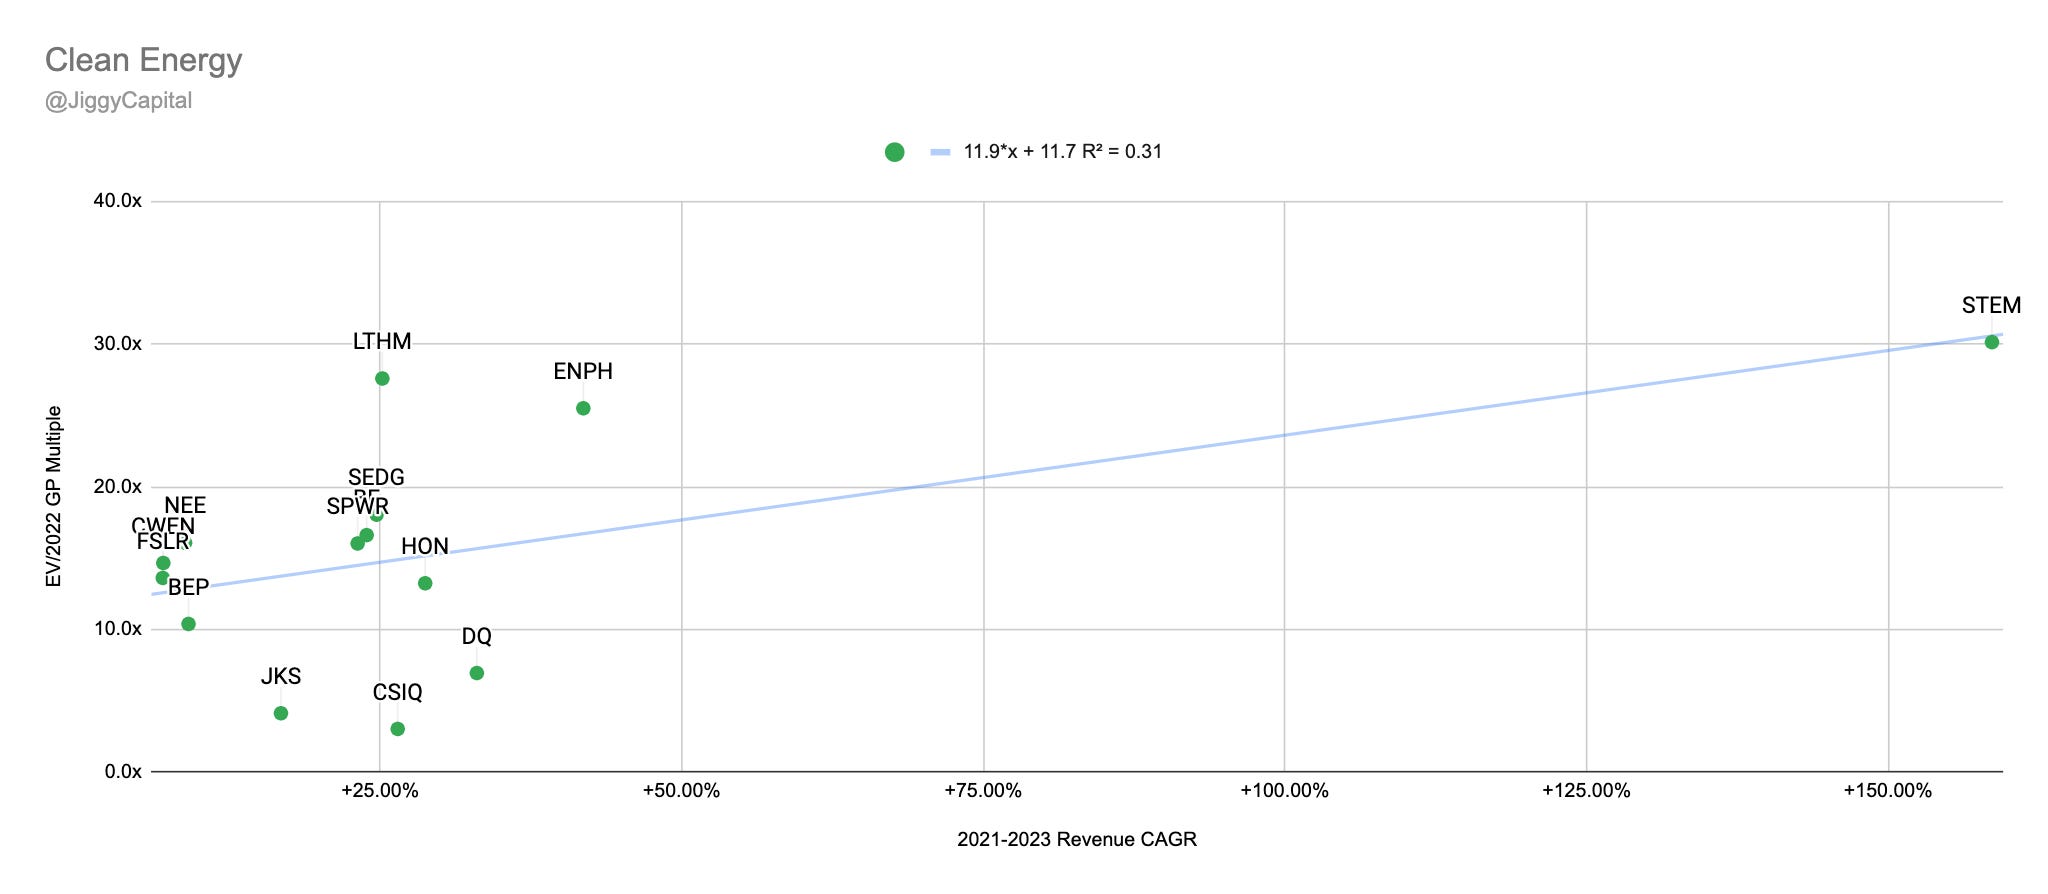
2021-2023 Revenue CAGR vs EV/2022 Gross Profit Multiple:
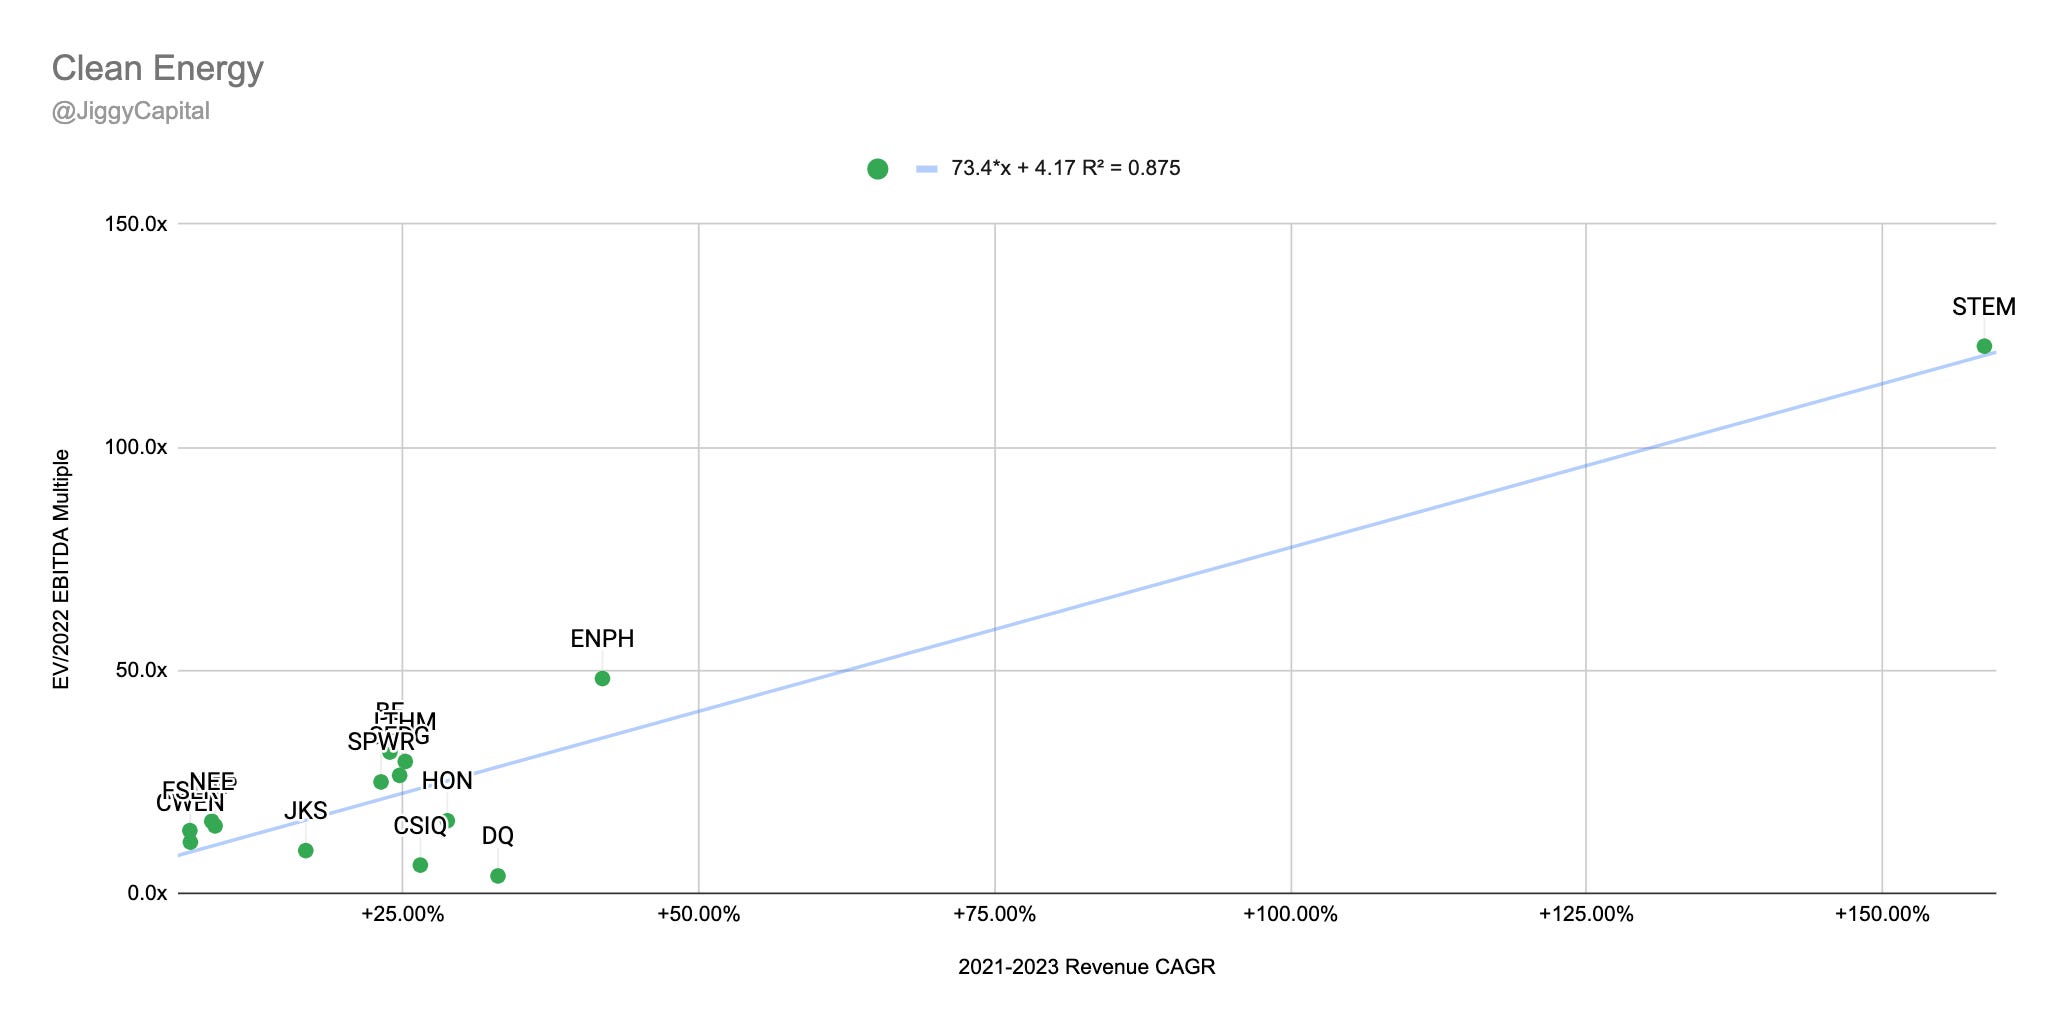
2021-2023 Revenue CAGR vs EV/2022 EBITDA Multiple:
Sector Stats:
Median Gross Margins: 27%
Median 2022e EBITDA Margin: 23%
Median 2021-2023 Projected Revenue CAGR: 25%
Median EV/2022e GP Multiple: 15.2x
Median EV/2022e EBITDA Multiple: 16.3x
Sector Highlights:
Strongest Gross Margins: Clearway Energy (69%)
Strongest 2022e EBITDA Margins: Clearway Energy (88%)
Strongest 2021-2023 Projected Revenue CAGR: Stem (158%)
Weakest Gross Margins: Stem (12%)
Weakest 2022e EBITDA Margins: FuelCell (-14%)
Weakest 2021-2023 Projected Revenue CAGR: First Solar (7%)
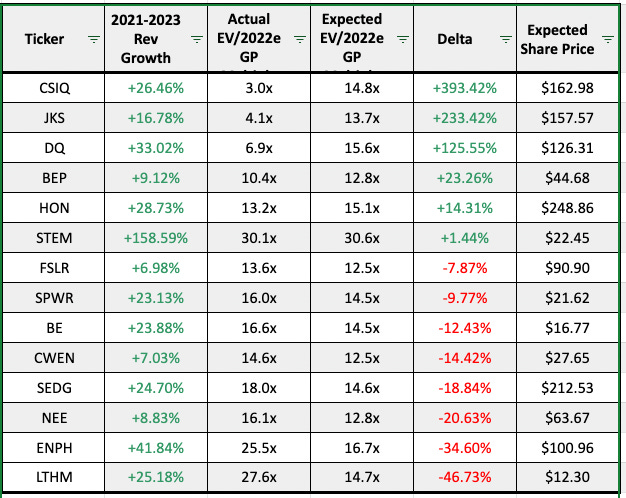
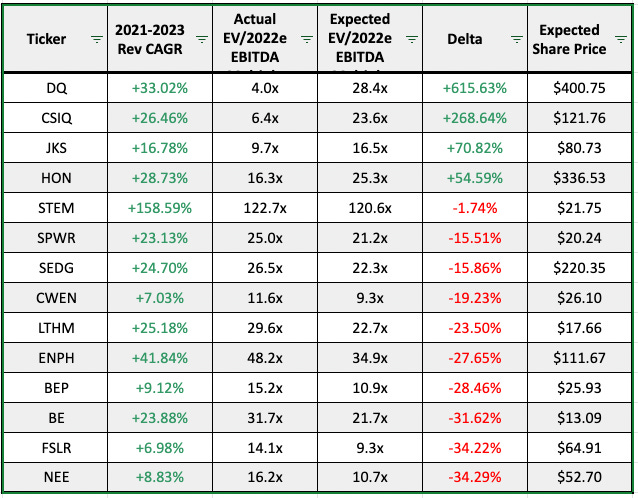
Scatter Plot Trendline Error Percentage:
“Undervalued”:
Gross Profit: Canadian Solar (+393% Upside)
EBITDA: Daqo New Energy (+615% Upside)
“Overvalued”:
Gross Profit: Livent (-46% Downside)
EBITDA: New Era Energy (-34% Downside)
Full Data:
Gross Profit:
EBITDA:
My Take
If you thought Facebook has a discount attached, look no further than the China discount attached to JKS, CSIQ and DQ. I think the most interesting part is a high R2 for both scatter plots and STEM not being out of whack. Should note their revenue CAGR is semi misleading as they are just beginning to ramp up their revenue (the reason I decided to leave the Auto sector out of this edition).
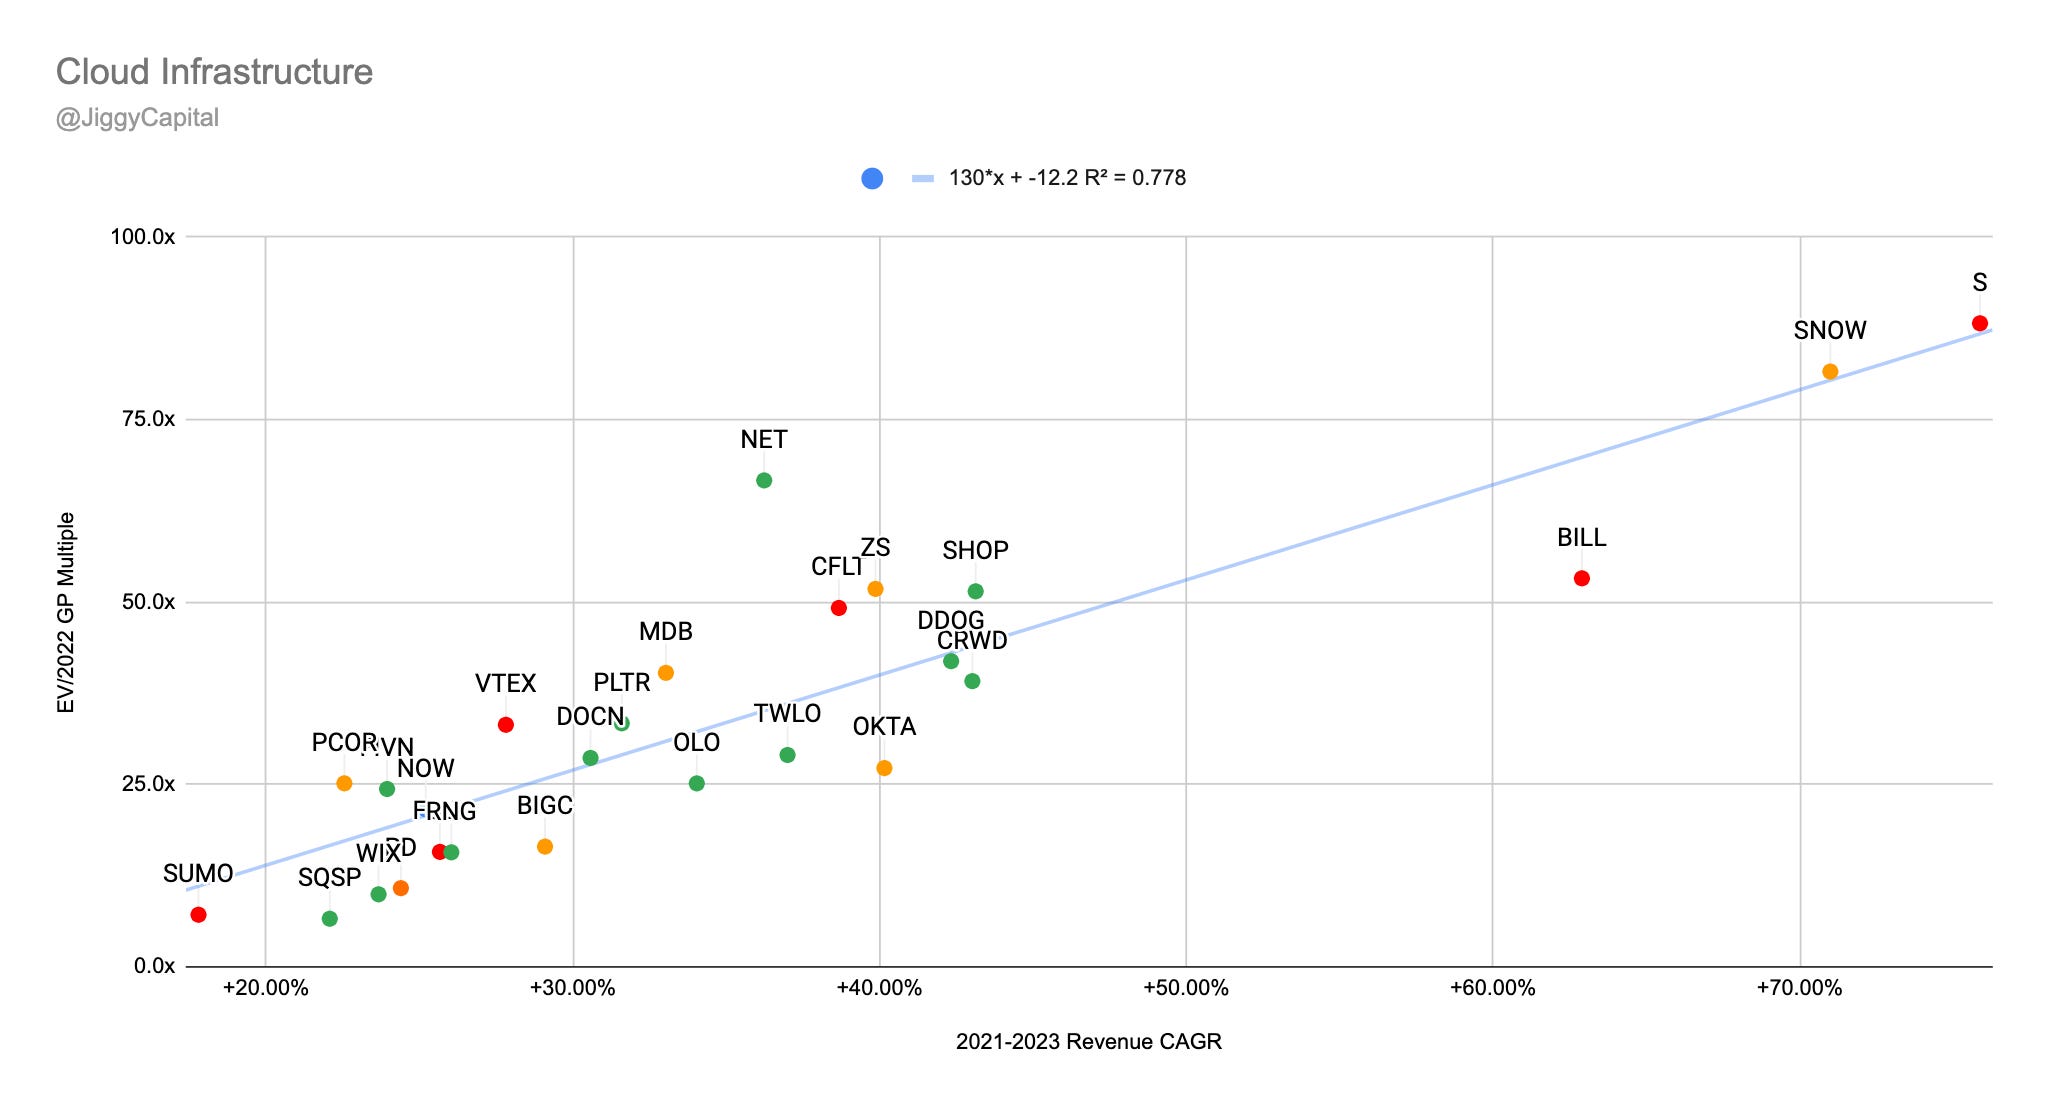
Cloud Infrastructure
Companies looked at: Bigcommerce (BIGC), Bill.com (BILL), Confluent (CFLT), Crowdstrike (CRWD), Datadog (DDOG), Digital Ocean (DOCN), Five9 (FIVN), Fastly (FSLY), MongoDB (MDB), Cloudflare (NET), ServiceNow (NOW), Okta (OTKA), Olo (OLO), Palantir (PLTR), RingCentral (RING), SentinelOne (S), Shopify (SHOP), Snowflake (SNOW), Squarespace (SQSP), Sumo Logic (SUMO), Twilio (TWLO), Vtex (VTEX), Wix.com (WIX), Zscaler (ZS)
Scatter Plots:
2021-2023 Revenue CAGR vs EV/2022 Gross Profit Multiple:
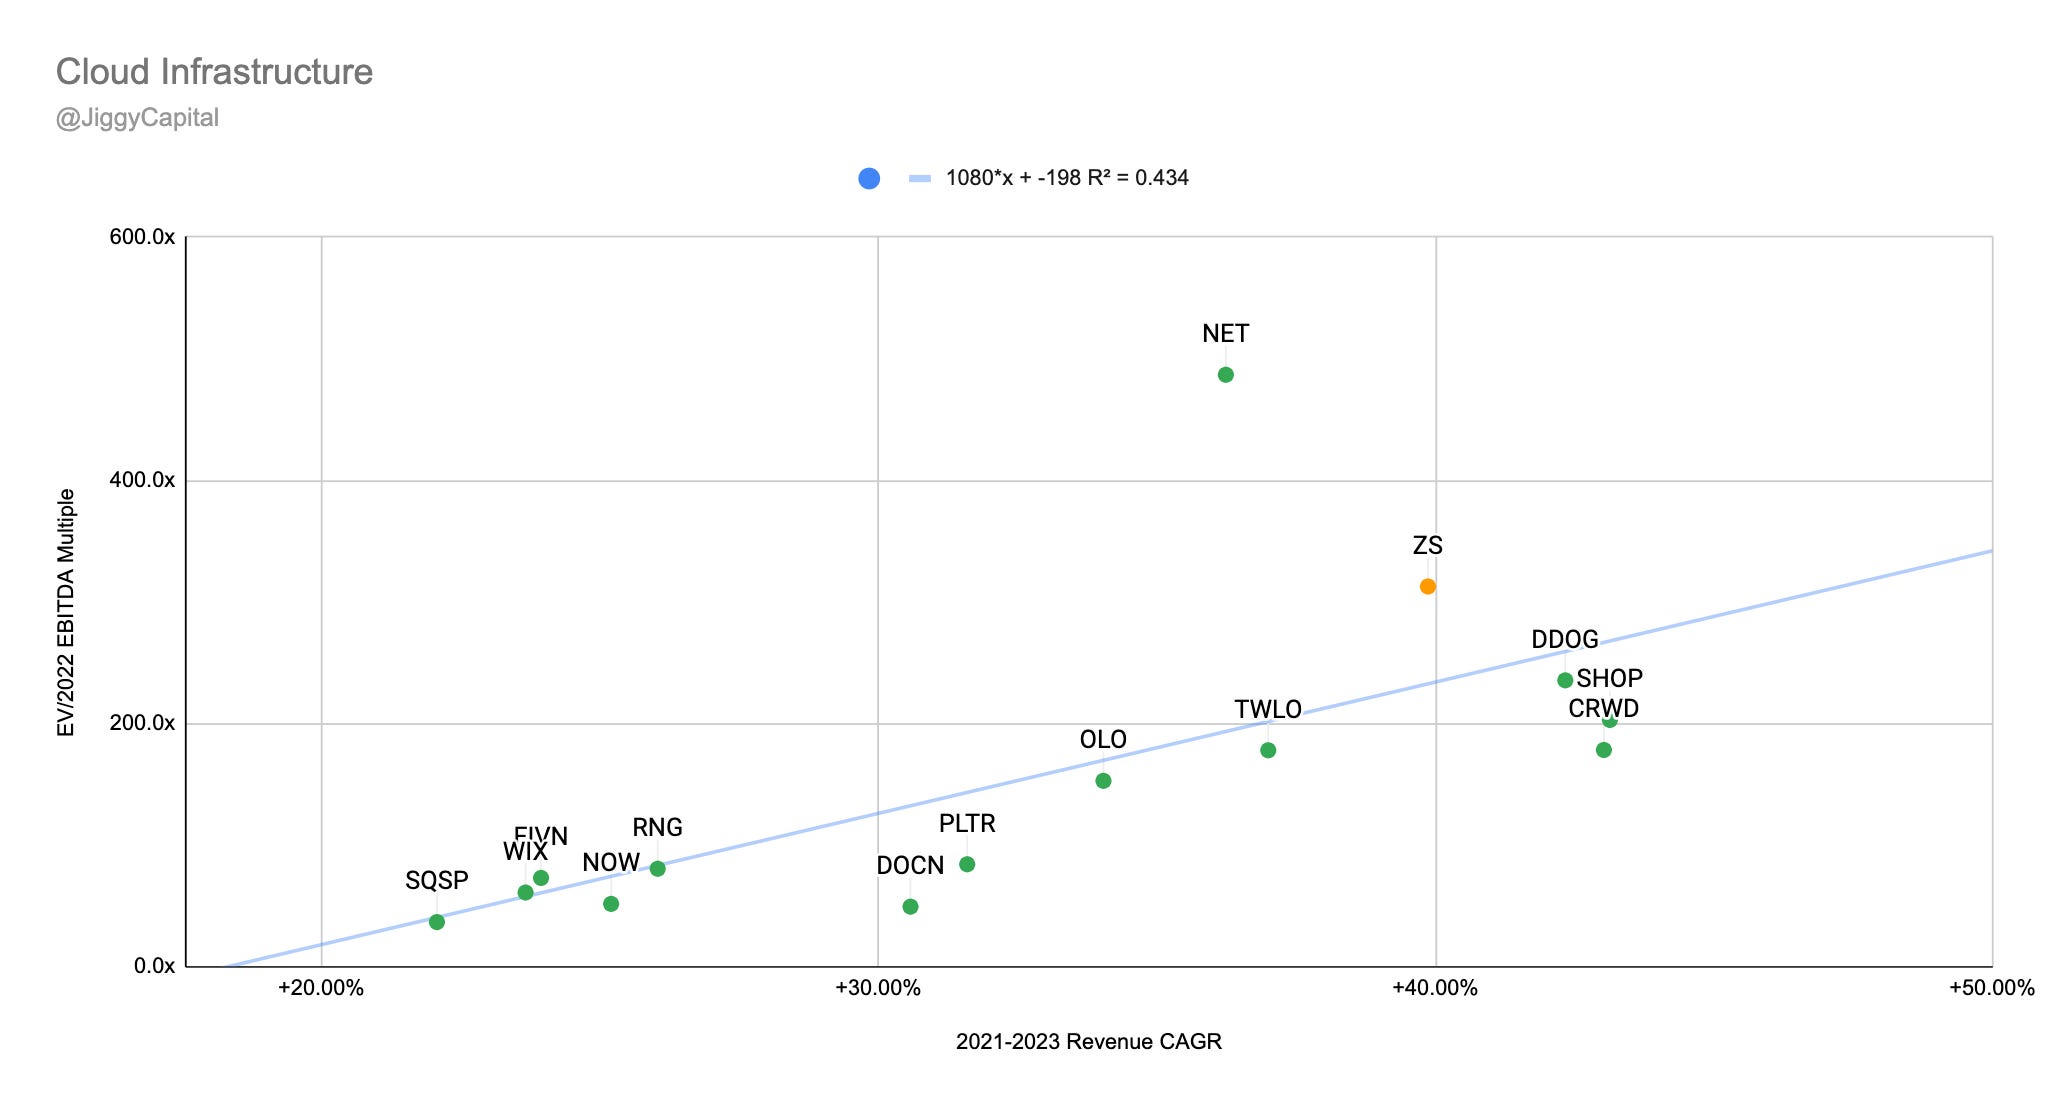
2021-2023 Revenue CAGR vs EV/2022 EBITDA Multiple:
Sector Stats:
Median Gross Margins: 72%
Median 2022e EBITDA Margin: 9%
Median 2021-2023 Projected Revenue CAGR: 32%
Median EV/2022e GP Multiple: 28.4x
Median EV/2022e EBITDA Multiple: 119.1x
Sector Highlights:
Strongest Gross Margins: PagerDuty (86%)
Strongest 2022e EBITDA Margins: ServiceNow (33%)
Strongest 2021-2023 Projected Revenue CAGR: SentinelOne (76%)
Weakest Gross Margins: Twilio (52%)
Weakest 2022e EBITDA Margins: SentinelOne (-53%)
Weakest 2021-2023 Projected Revenue CAGR: Sumo Logic (18%)
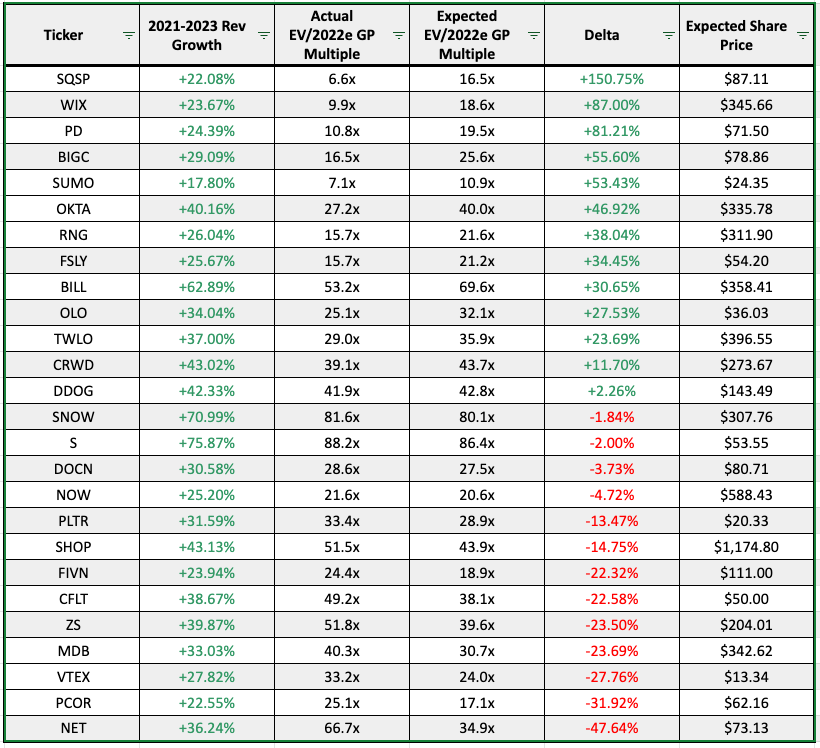
Scatter Plot Trendline Error Percentage:
“Undervalued”:
Gross Profit: SquareSpace (+150% Upside)
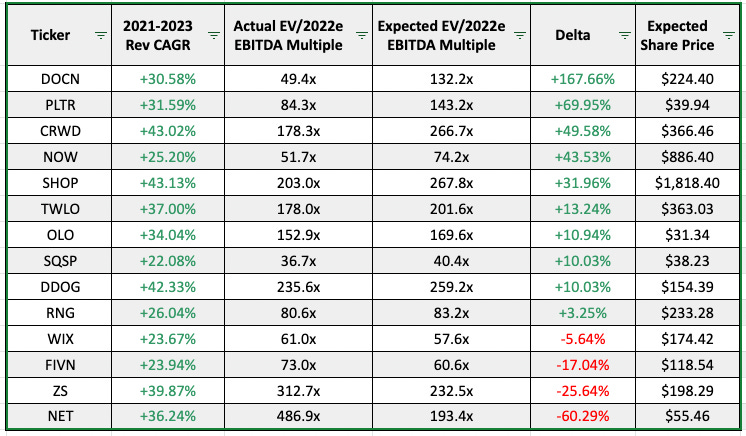
EBITDA: DigitalOcean (+168% Upside)
“Overvalued”:
Gross Profit: Cloudflare (-48% Downside)
EBITDA: Cloudflare (-60% Downside)
Full Data:
Gross Profit:
EBITDA:
My Take
Now isn’t this a fun group and scatter plots, especially comping the EBITDA multiples. Safe to say these stocks aren’t cheap, but I would also say they aren’t gunning for bottom line prowess currently and I can’t blame them. No surprise Cloudflare looks expensive here! The other eCommerce SaaS players get little love in the shadows of Shopify, and for good reason.
eCommerce
Companies looked at: Amazon (AMZN), Alibaba Group (BABA), BarkBox (BARK), Chewy (CHWY), Coupang (CPNG), eBay (EBAY), Etsy (ETSY), Farfetch (FTCH), JD.com (JD), Jumia (JMIA), Mercadolibre (MELI), Ozon (OZON), Pinduoduo (PDD), Poshmark (POSH), TheRealReal (REAL), Sea (SE), Stitch Fix (SFIX), ThredUp (TDUP), Wayfair (W)
Scatter Plots:
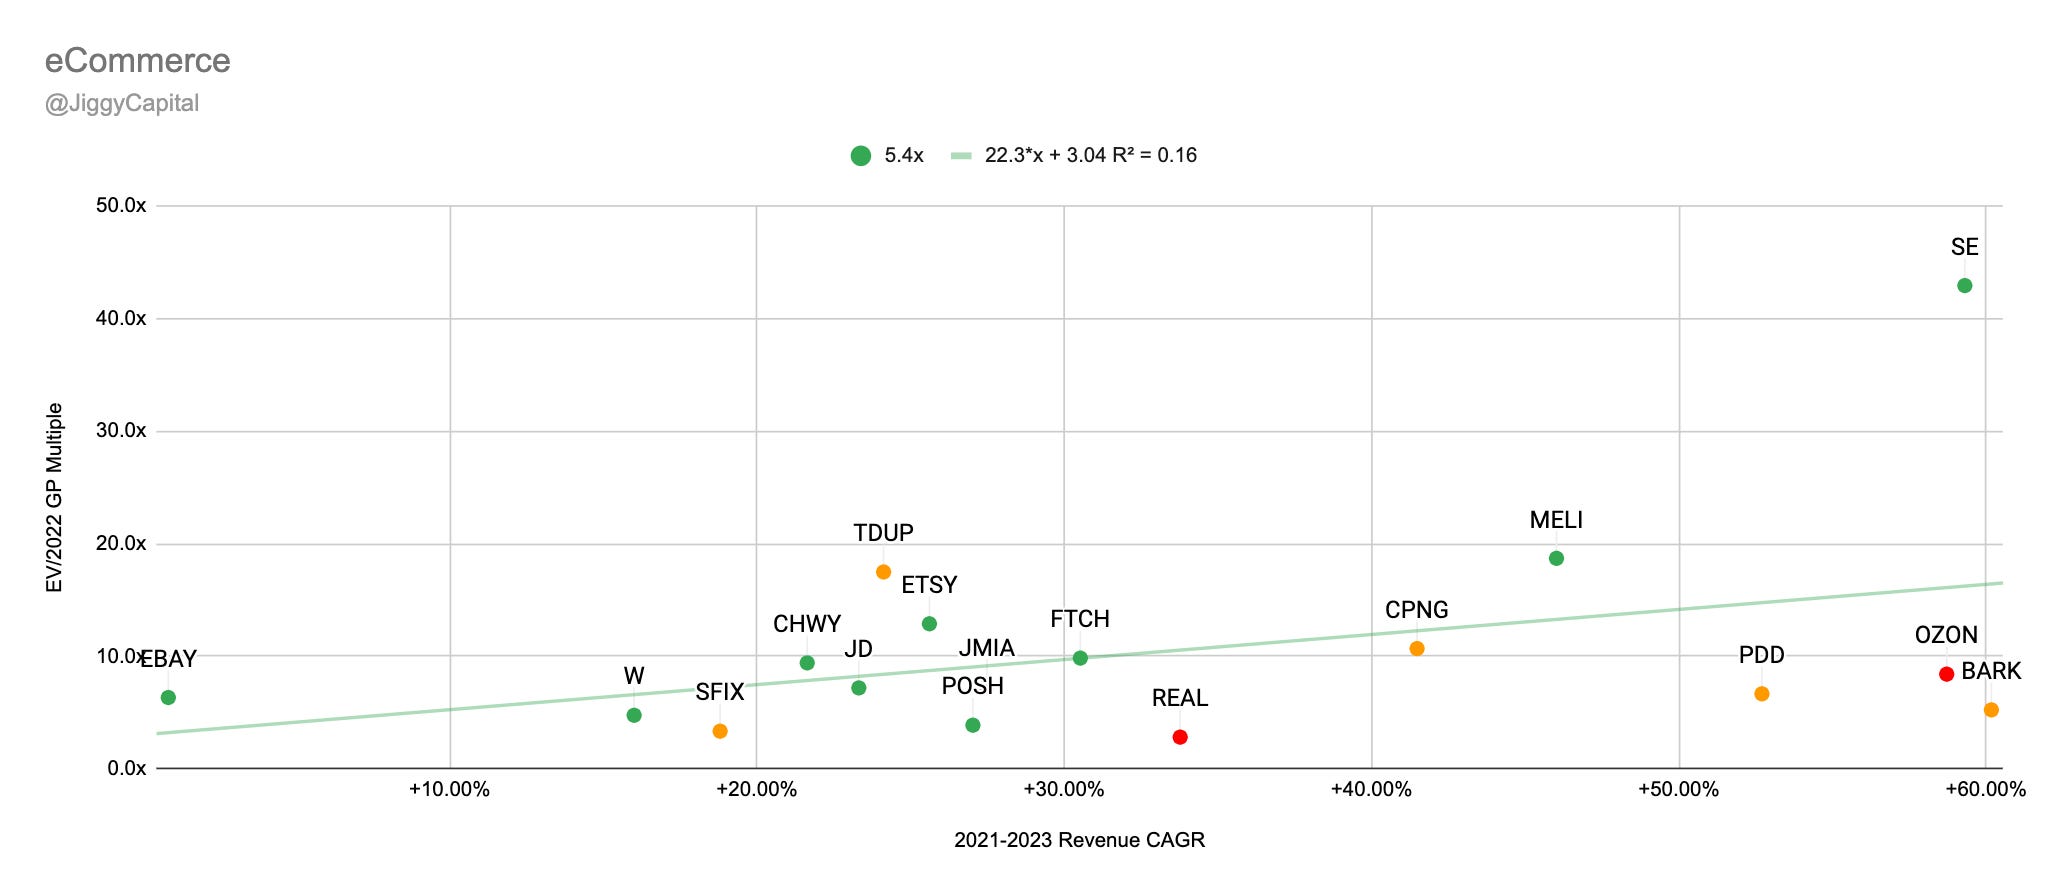
2021-2023 Revenue CAGR vs EV/2022 Gross Profit Multiple:
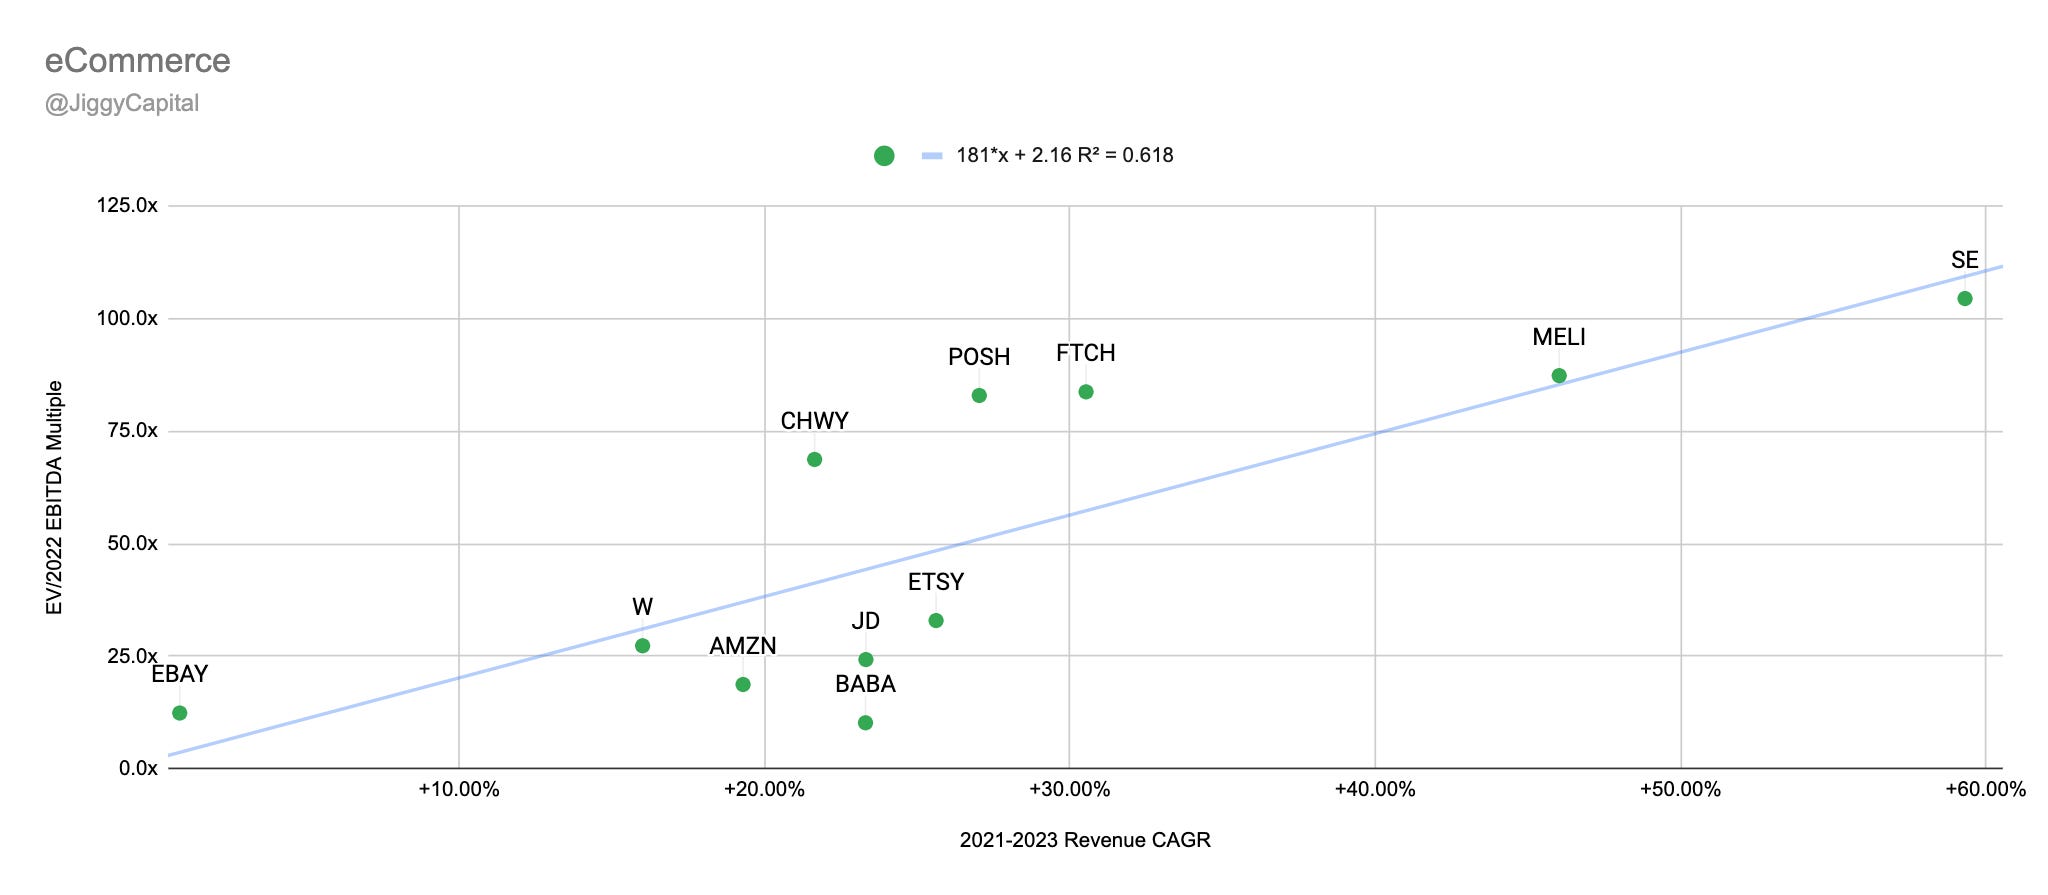
2021-2023 Revenue CAGR vs EV/2022 EBITDA Multiple:
Sector Stats:
Median Gross Margins: 45%
Median 2022e EBITDA Margin: 3%
Median 2021-2023 Projected Revenue CAGR: 27%
Median EV/2022e GP Multiple: 7.1x
Median EV/2022e EBITDA Multiple: 51.7x
Sector Highlights:
Strongest Gross Margins: Poshmark (83%)
Strongest 2022e EBITDA Margins: eBay (38%)
Strongest 2021-2023 Projected Revenue CAGR: BarkBox (60%)
Weakest Gross Margins: JD.com (8%)
Weakest 2022e EBITDA Margins: Jumia (-55%)
Weakest 2021-2023 Projected Revenue CAGR: eBay (1%)
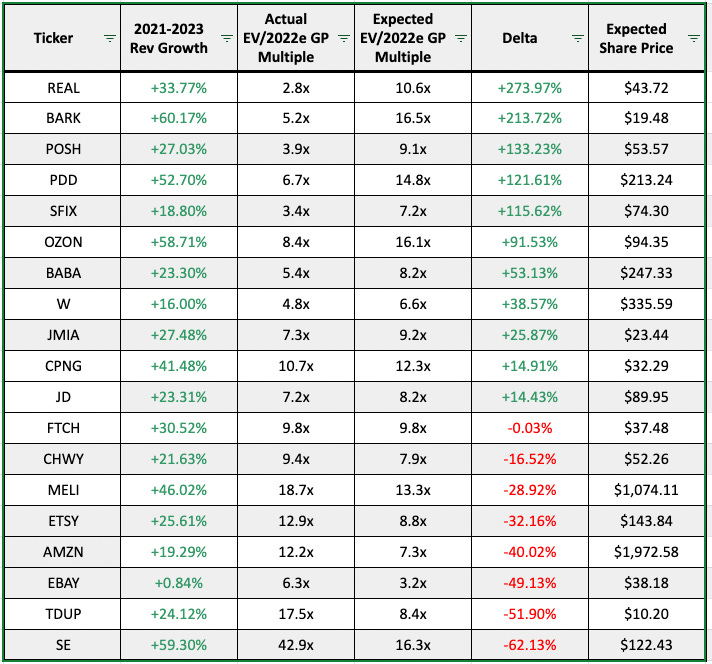
Scatter Plot Trendline Error Percentage:
“Undervalued”:
Gross Profit: TheRealReal (+274% Upside)
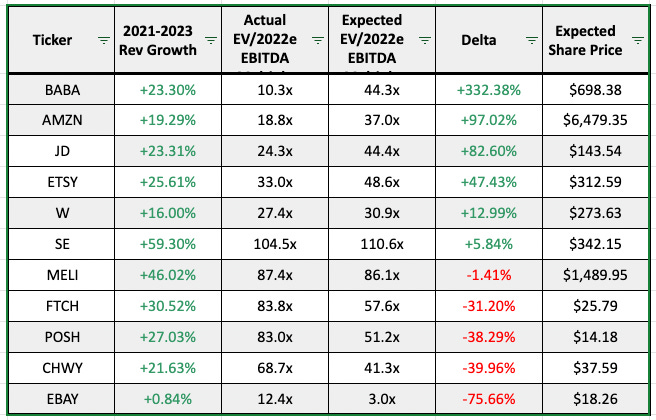
EBITDA: Alibaba (+332% Upside)
“Overvalued”:
Gross Profit: Sea Limited (-62% Downside)
EBITDA: eBay (-76% Downside)
Full Data:
Gross Profit:
EBITDA:
My Take
eCommerce multiples tell you that the market doesn’t value it the same as some other sectors for whatever reason. I find it amusing how Sea Limited (not a great comp since many layers to company) is so “overvalued” on the EV/GP multiple, but is actually “undervalued” on an EBITDA multiple basis. Alibaba comes to no surprise with all that company has gone through this year.
Fintech
Companies looked at: Affirm (AFRM), Avalara (AVLR), Blend Labs (BLND), Dlocal (DLO), Fiserv (FISV), Flywire (FLYW), Shift4 Payments (FOUR), Futu (FUTU), Global-E (GLBE), Robinhood (HOOD), LendingClub (LC), Lightspeed Commerce (LSPD), Marqeta (MQ), PagSeguro (PAGS), Paypal (PYPL), SoFi (SOFI), Square (SQ), StoneCo (STNE), Constellation Brands (STZ), UpFintech (TIGR), Upstart (UPST)
Scatter Plots:
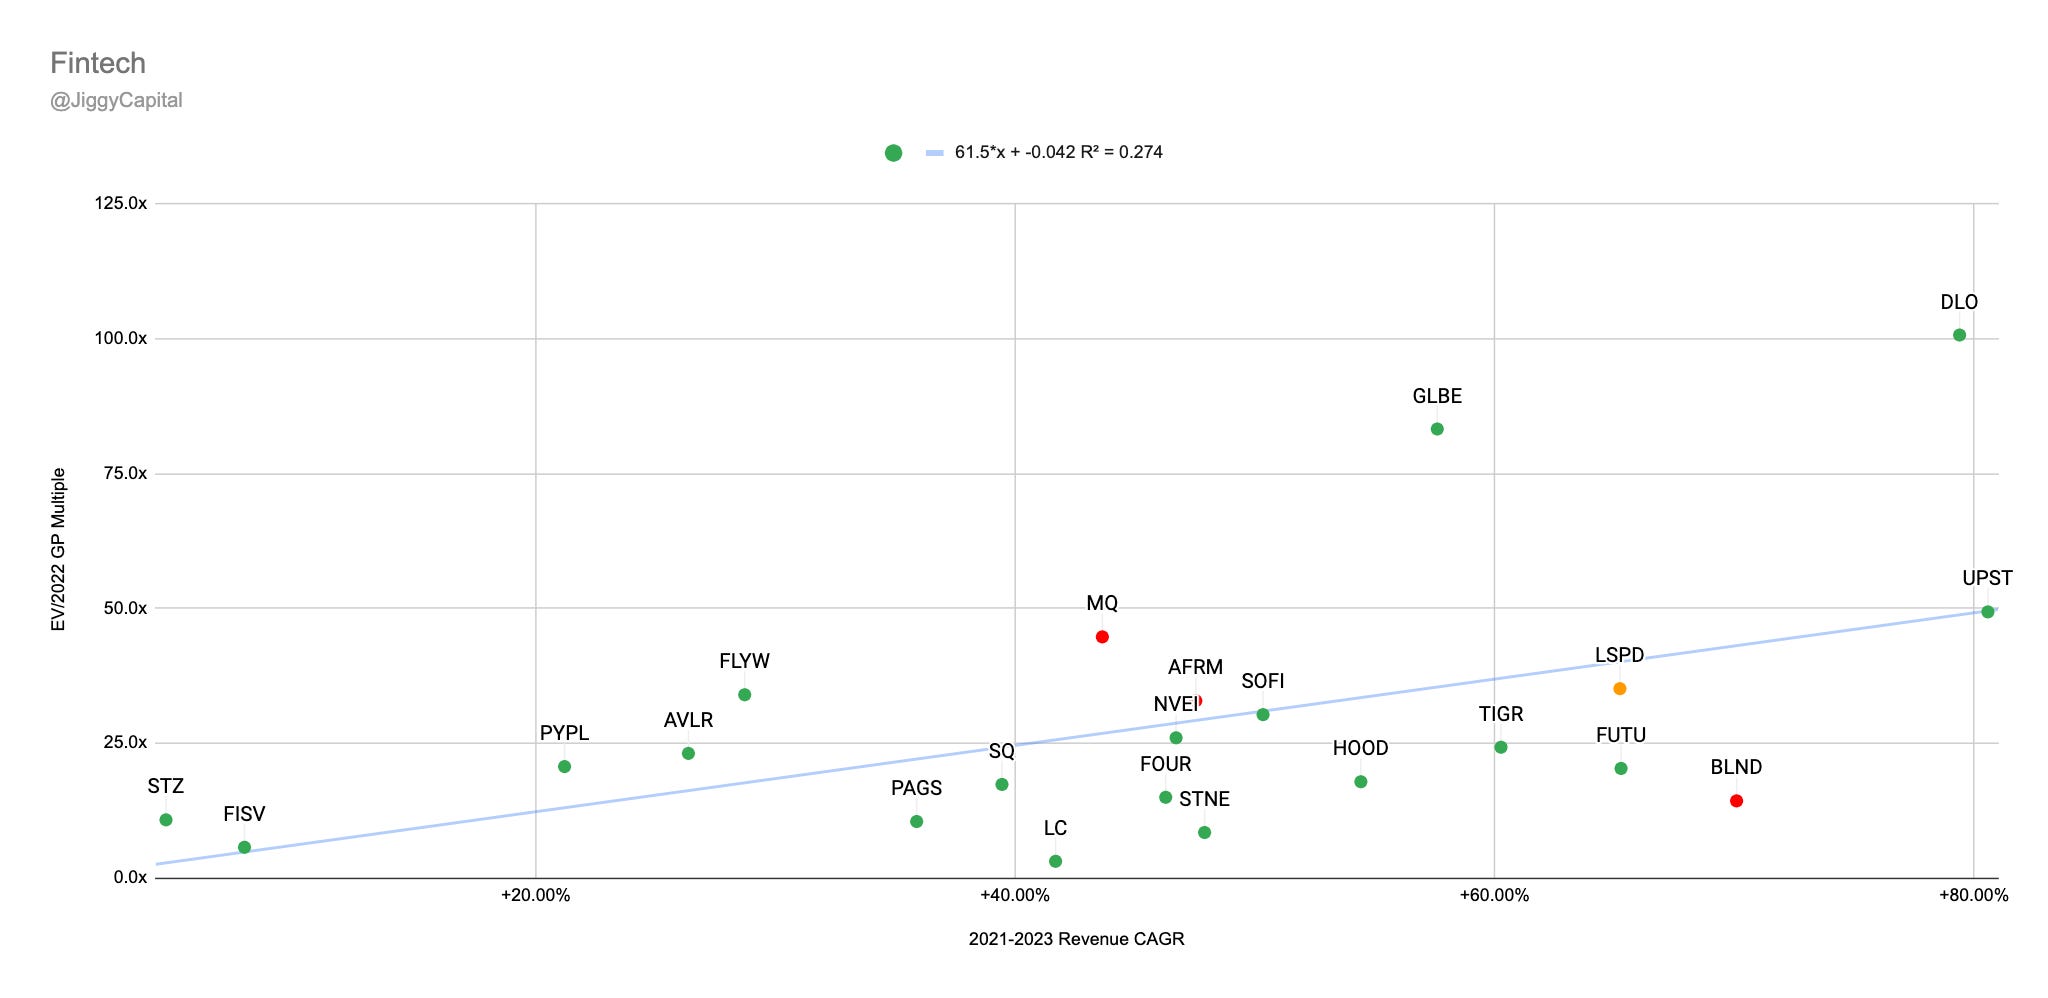
2021-2023 Revenue CAGR vs EV/2022 Gross Profit Multiple:
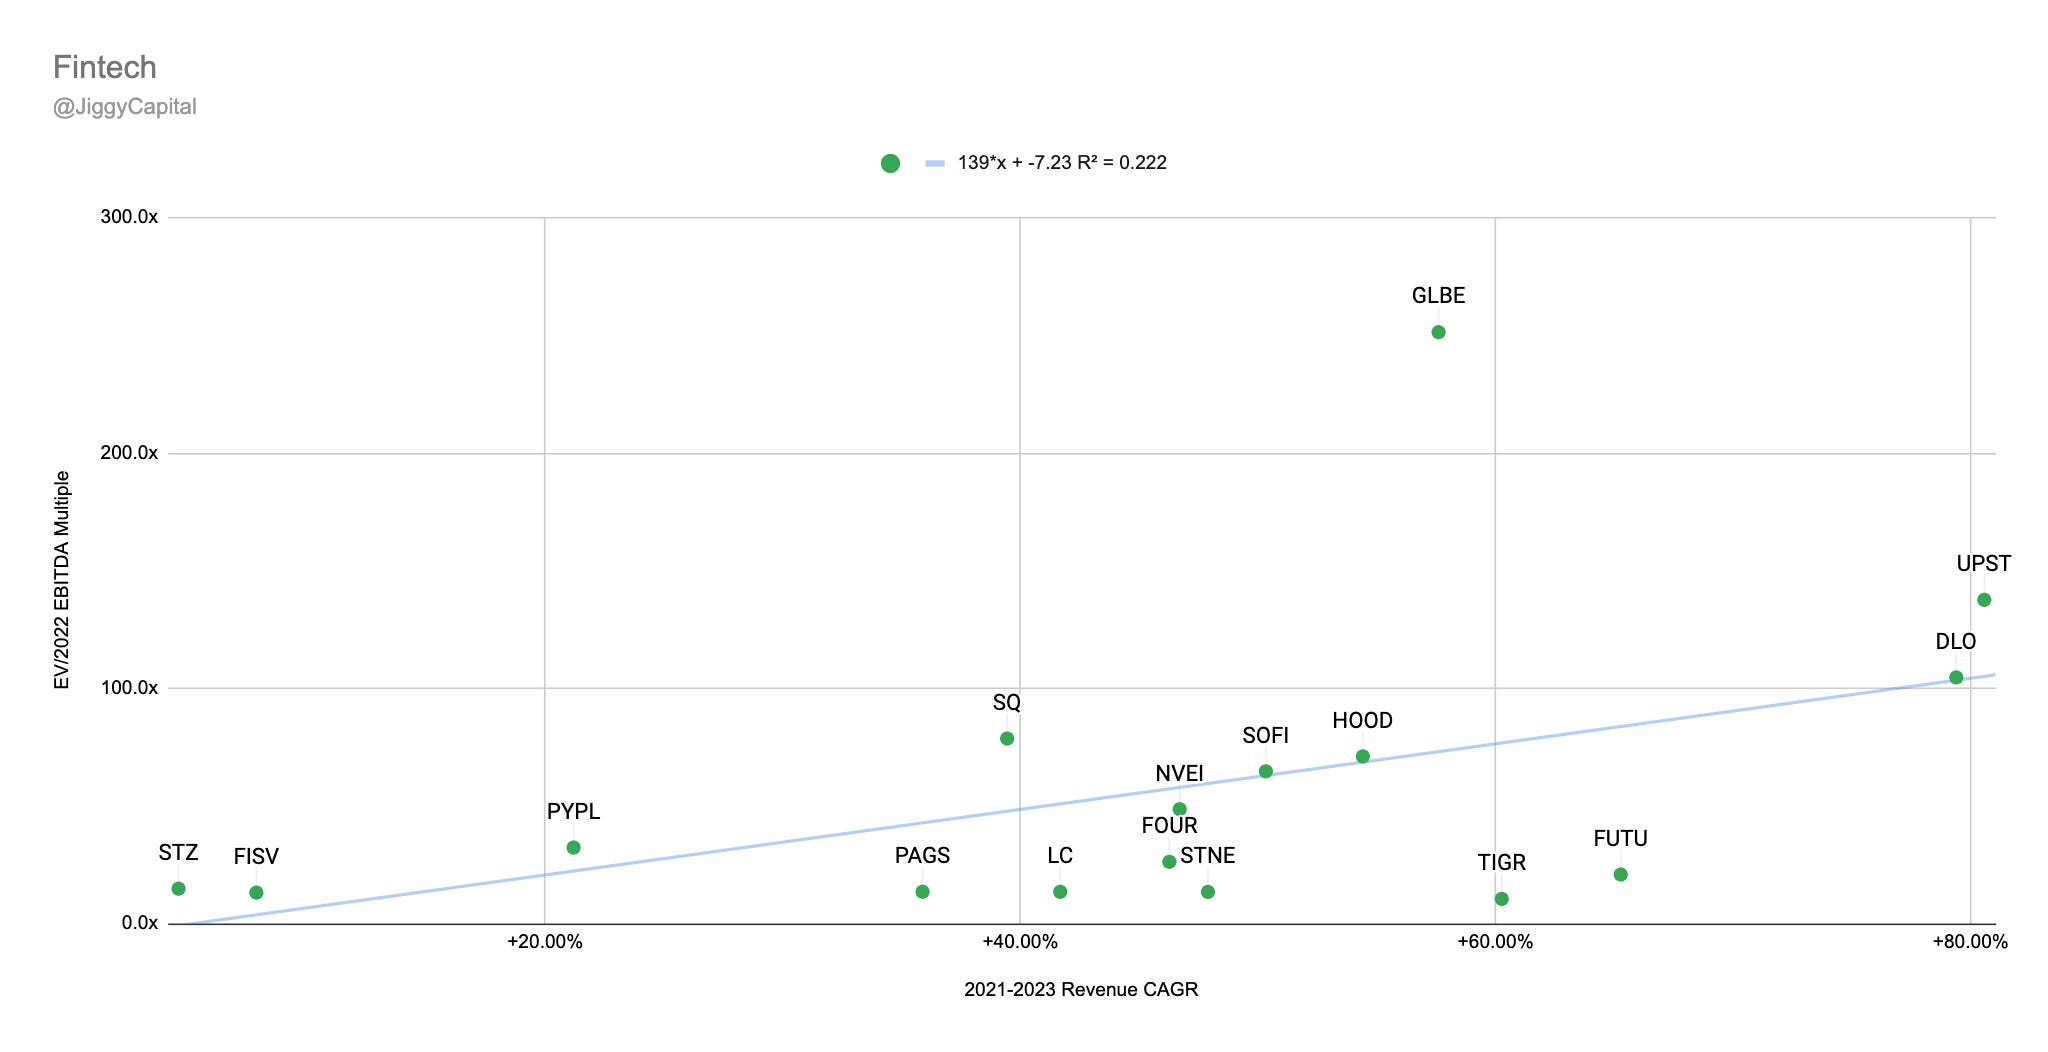
2021-2023 Revenue CAGR vs EV/2022 EBITDA Multiple:
Sector Stats:
Median Gross Margins: 46%
Median 2022e EBITDA Margin: 18%
Median 2021-2023 Projected Revenue CAGR: 47%
Median EV/2022e GP Multiple: 20.1x
Median EV/2022e EBITDA Multiple: 27.7x
Sector Highlights:
Strongest Gross Margins: StoneCo (76%)
Strongest 2022e EBITDA Margins: StoneCo (48%)
Strongest 2021-2023 Projected Revenue CAGR: Upstart (81%)
Weakest Gross Margins: Up Fintech (16%)
Weakest 2022e EBITDA Margins: Blend Labs (-44%)
Weakest 2021-2023 Projected Revenue CAGR: Fiserv (6%)
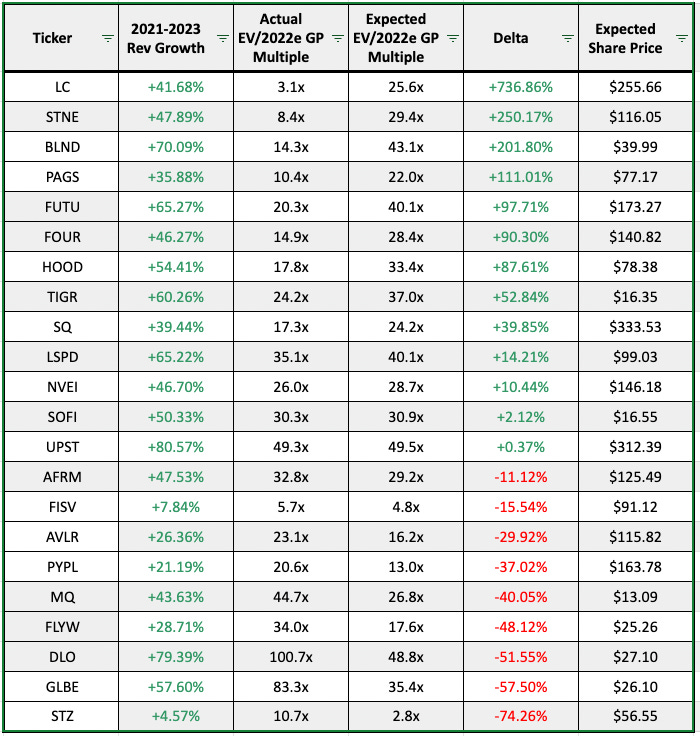
Scatter Plot Trendline Error Percentage:
“Undervalued”:
Gross Profit: Lending Club (+736% Upside)
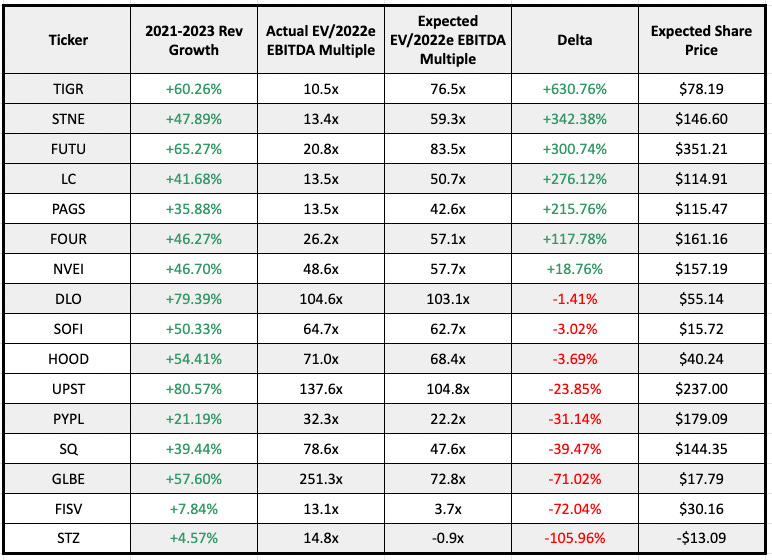
EBITDA: Up Fintech (+630% Upside)
“Overvalued”:
Gross Profit: Global-E (-57% Downside)
EBITDA: Fiserv (-72% Downside)
Full Data:
Gross Profit:
EBITDA:
My Take
This is a really interesting group to look at on a more bottom line view with EBITDA as the 2021 high flying IPO’s that people attach together - Global-E and D Local - they couldn’t be more different on a EBITDA multiple basis as D Local has incredibly impressive bottom line margins. Misunderstood stock by most of Fintwit but I have no position. The main “undervalued” stocks all have geopolitical risks attached to them in STNE, TIGR, FUTU, PAGS.
Food & Drink
Companies looked at: BurgerFi (BFI), Beyond Meat (BYND), Chiptole Mexican Grill (CMG), Domino’s Pizza (DPZ), Darden Restaurants (DRI), Jack in the Box (JACK), McDonald’s (MCD), Noodles & Co (NDLS), Oatly (OTLY), Restaurant Brands International (QSR), Red Robin Gourmet Burgers (RRGB), Startbucks (SBUX), Shake Shack (SHAK), Tattooed Chef (TTCF), Texas Roadhouse Inc (TXRH), Wendys (WEN), Wingstop (WING), Yum! Brands (YUM)
Scatter Plots:
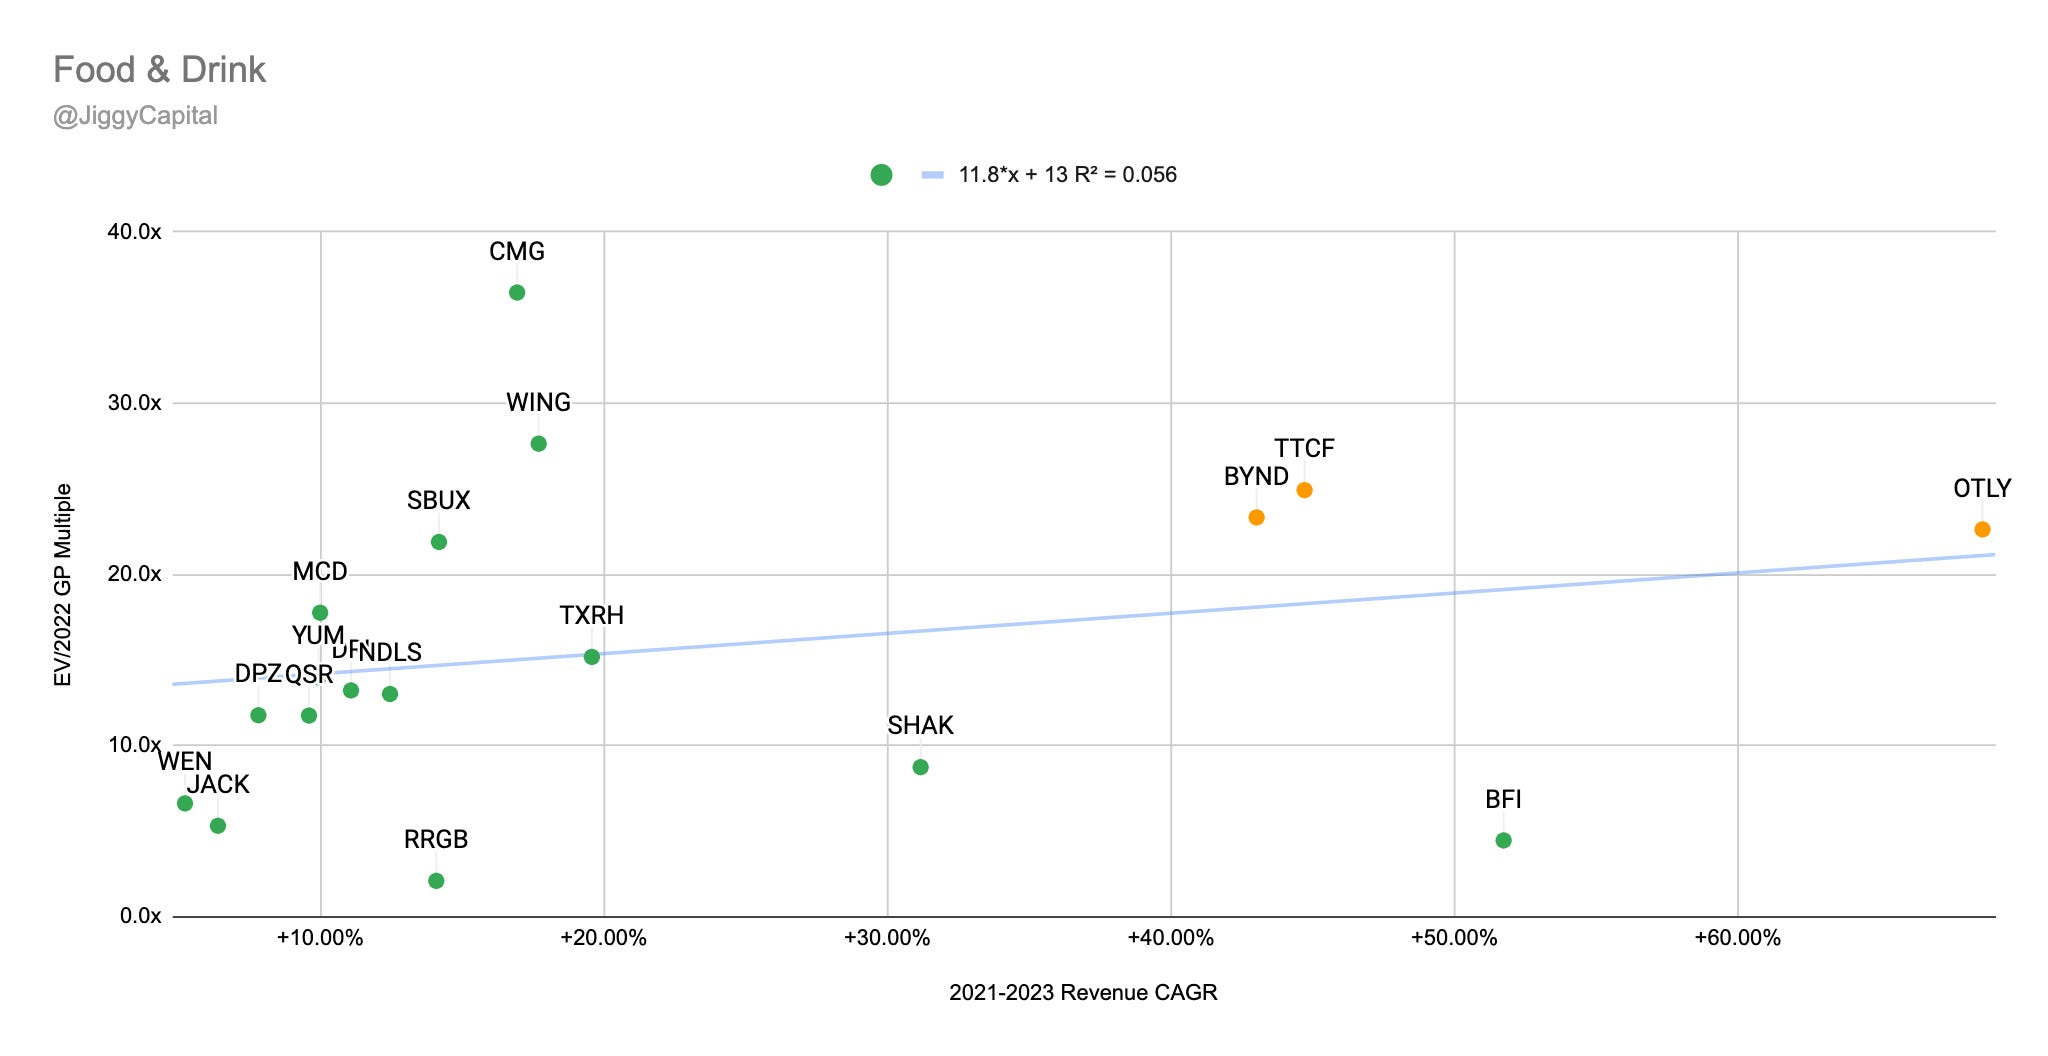
2021-2023 Revenue CAGR vs EV/2022 Gross Profit Multiple:
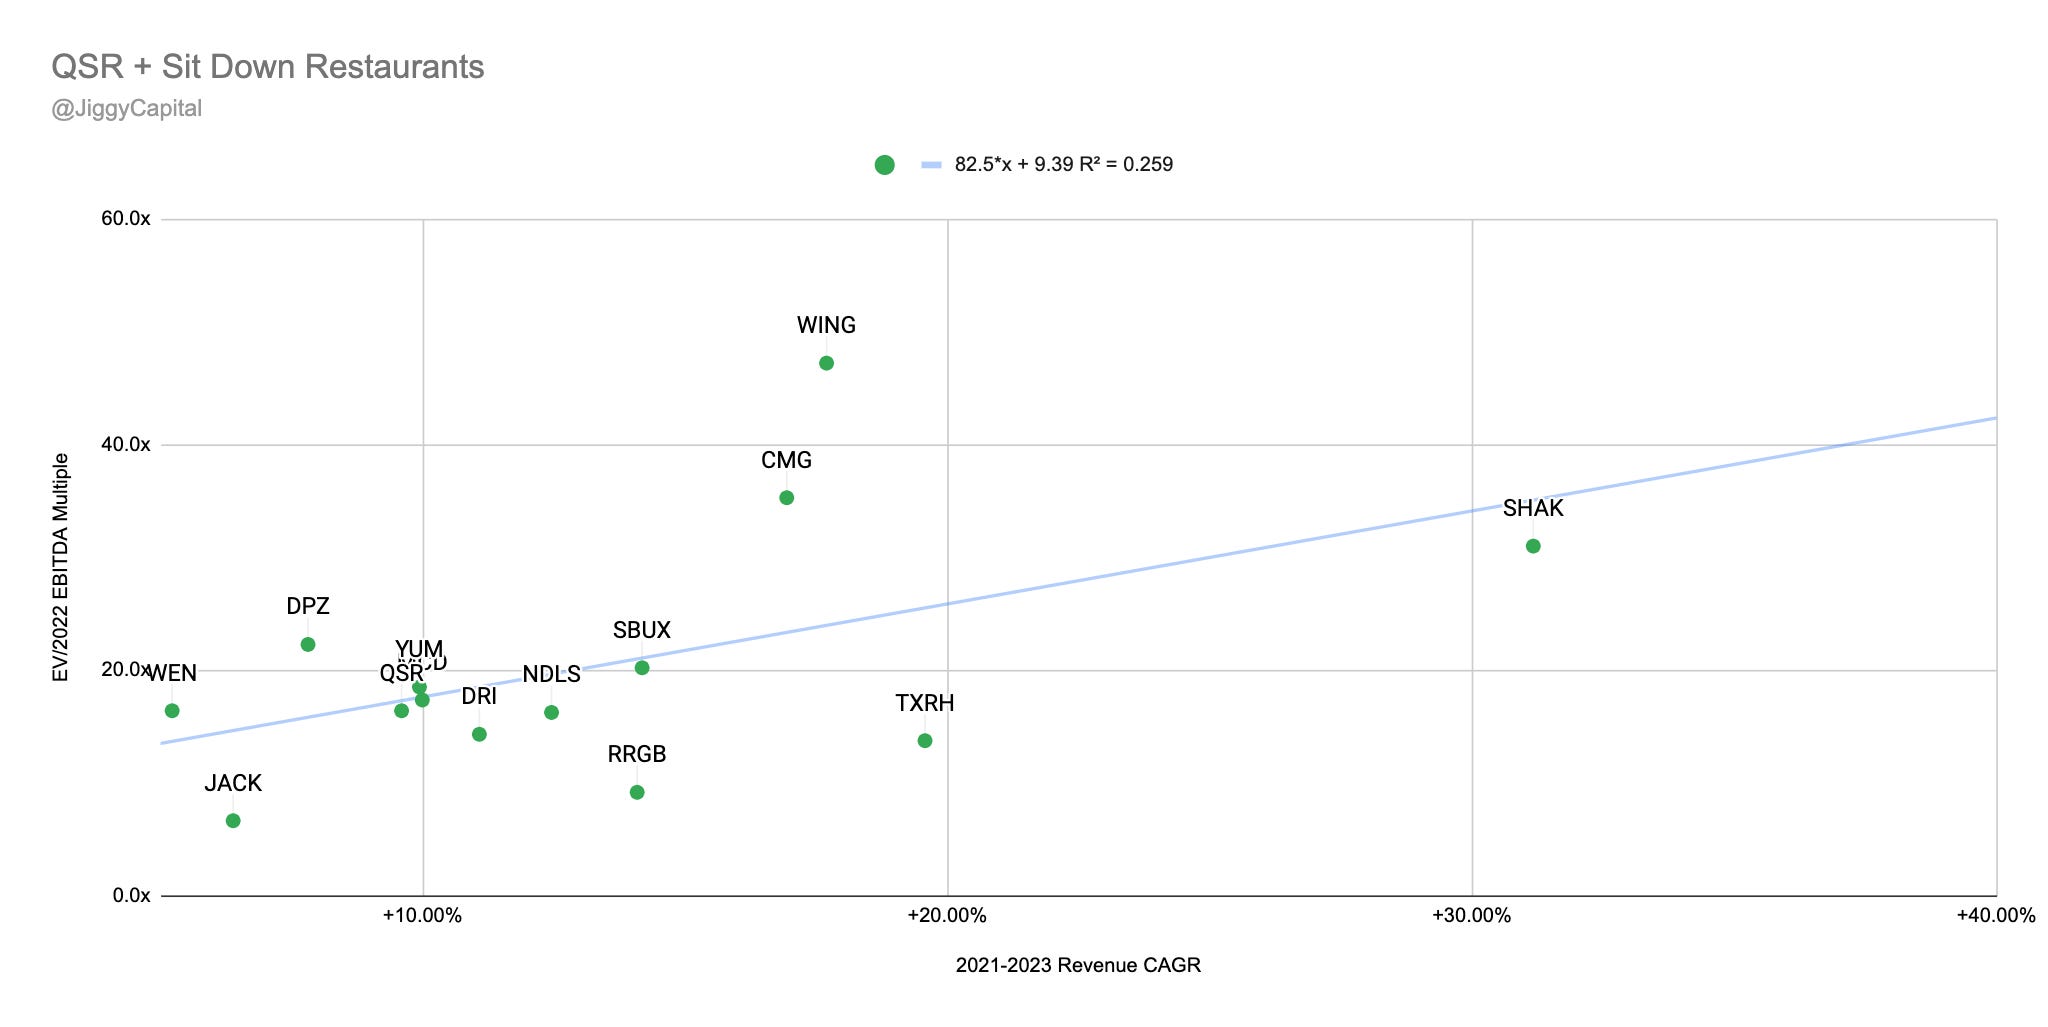
2021-2023 Revenue CAGR vs EV/2022 EBITDA Multiple:
Sector Stats:
Median Gross Margins: 34%
Median 2022e EBITDA Margin: 18%
Median 2021-2023 Projected Revenue CAGR: 14%
Median EV/2022e GP Multiple: 13.7x
Median EV/2022e EBITDA Multiple: 16/9x
Sector Highlights:
Strongest Gross Margins: Wendy’s (64%)
Strongest 2022e EBITDA Margins: McDonald’s (52%)
Strongest 2021-2023 Projected Revenue CAGR: Oatly (68%)
Weakest Gross Margins: Texas Roadhouse (12%)
Weakest 2022e EBITDA Margins: Oatly (-4%)
Weakest 2021-2023 Projected Revenue CAGR: Wendy’s (5%)
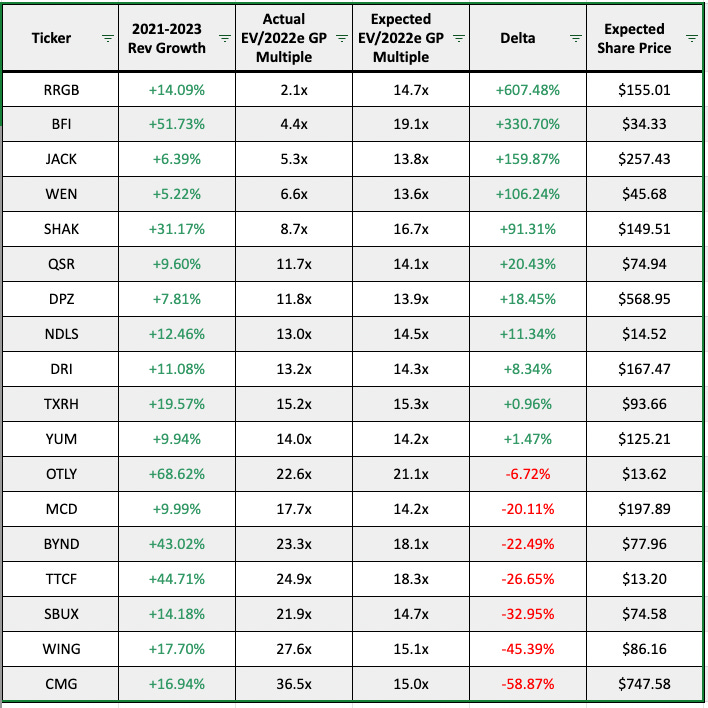
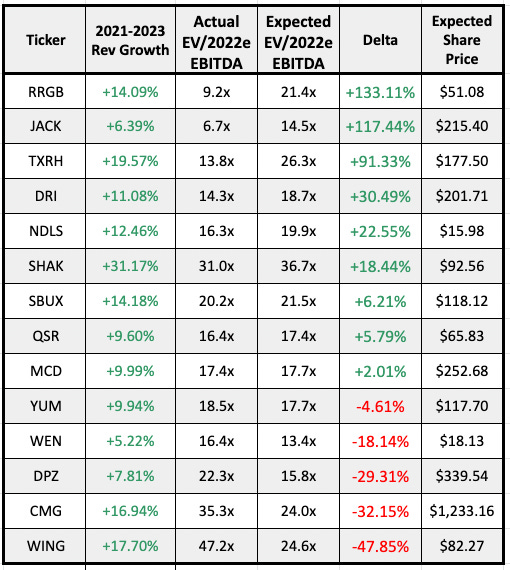
Scatter Plot Trendline Error Percentage:
“Undervalued”:
Gross Profit: Red Robin Gourmet Burger (+607% Upside)
EBITDA: Red Robin Gourmet Burger (+113% Upside)
“Overvalued”:
Gross Profit: Chipotle (-59% Downside)
EBITDA: Wingstop (-48% Downside)
Full Data:
Gross Profit:
EBITDA:
My Take
Although there’s some interesting dynamics to this group such as “eat local” trends, I really like the group and I think you just have to look at some of the LT charts of Wingstop, Chipotle, Domino’s, McDonalds etc to see that the market likes this sector a lot too. It’s tough to gauge these companies as is because they’re all quite decimated so their growth either looks much better than reality (playing catch up from 2019), or their bottom line economics are so out of whack currently. My horse in this group is Shake Shack (smallest position in port)
Gaming
Companies looked at: Applovin (APP), Activision Blizzard (ATVI), Electronic Arts (EA), Nintendo (NTDOY), Roblox (RBLX), Sea (SE), Skillz (SKLZ), Tencent (TCEHY), Take-Two Interactive (TTWO), Unity (U)
Scatter Plots:
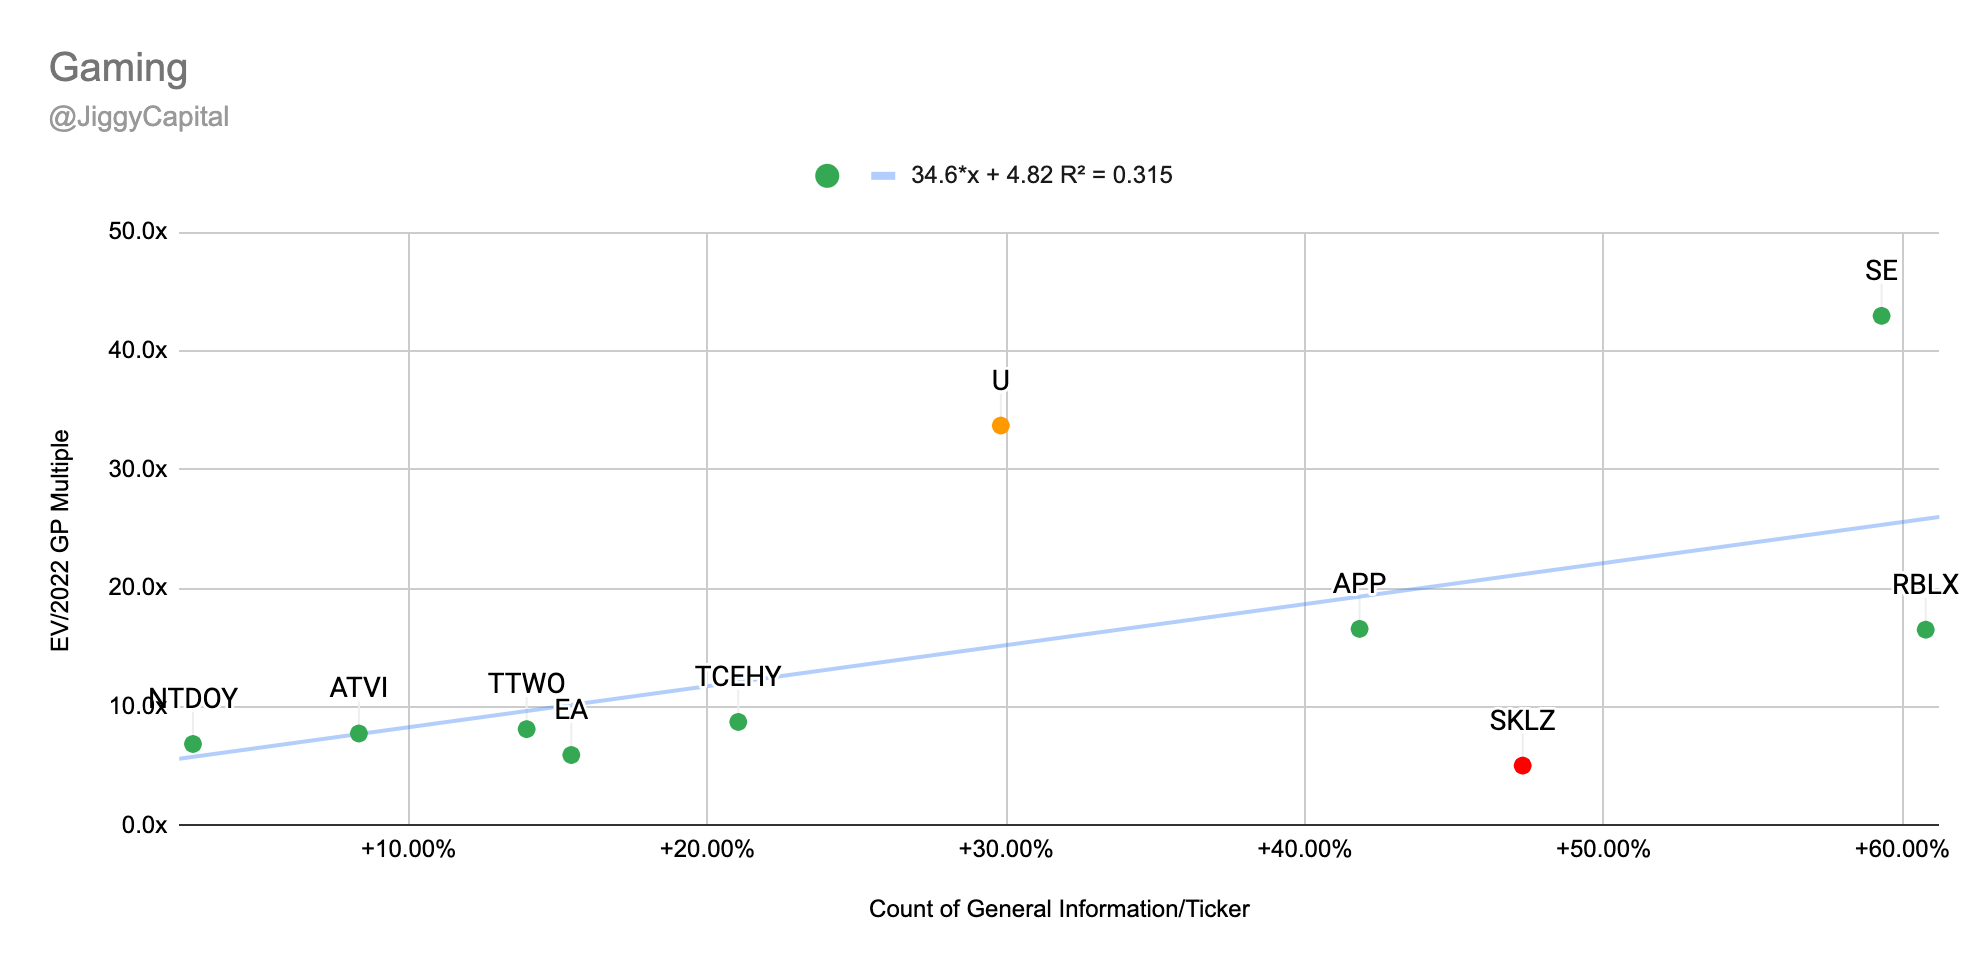
2021-2023 Revenue CAGR vs EV/2022 Gross Profit Multiple:
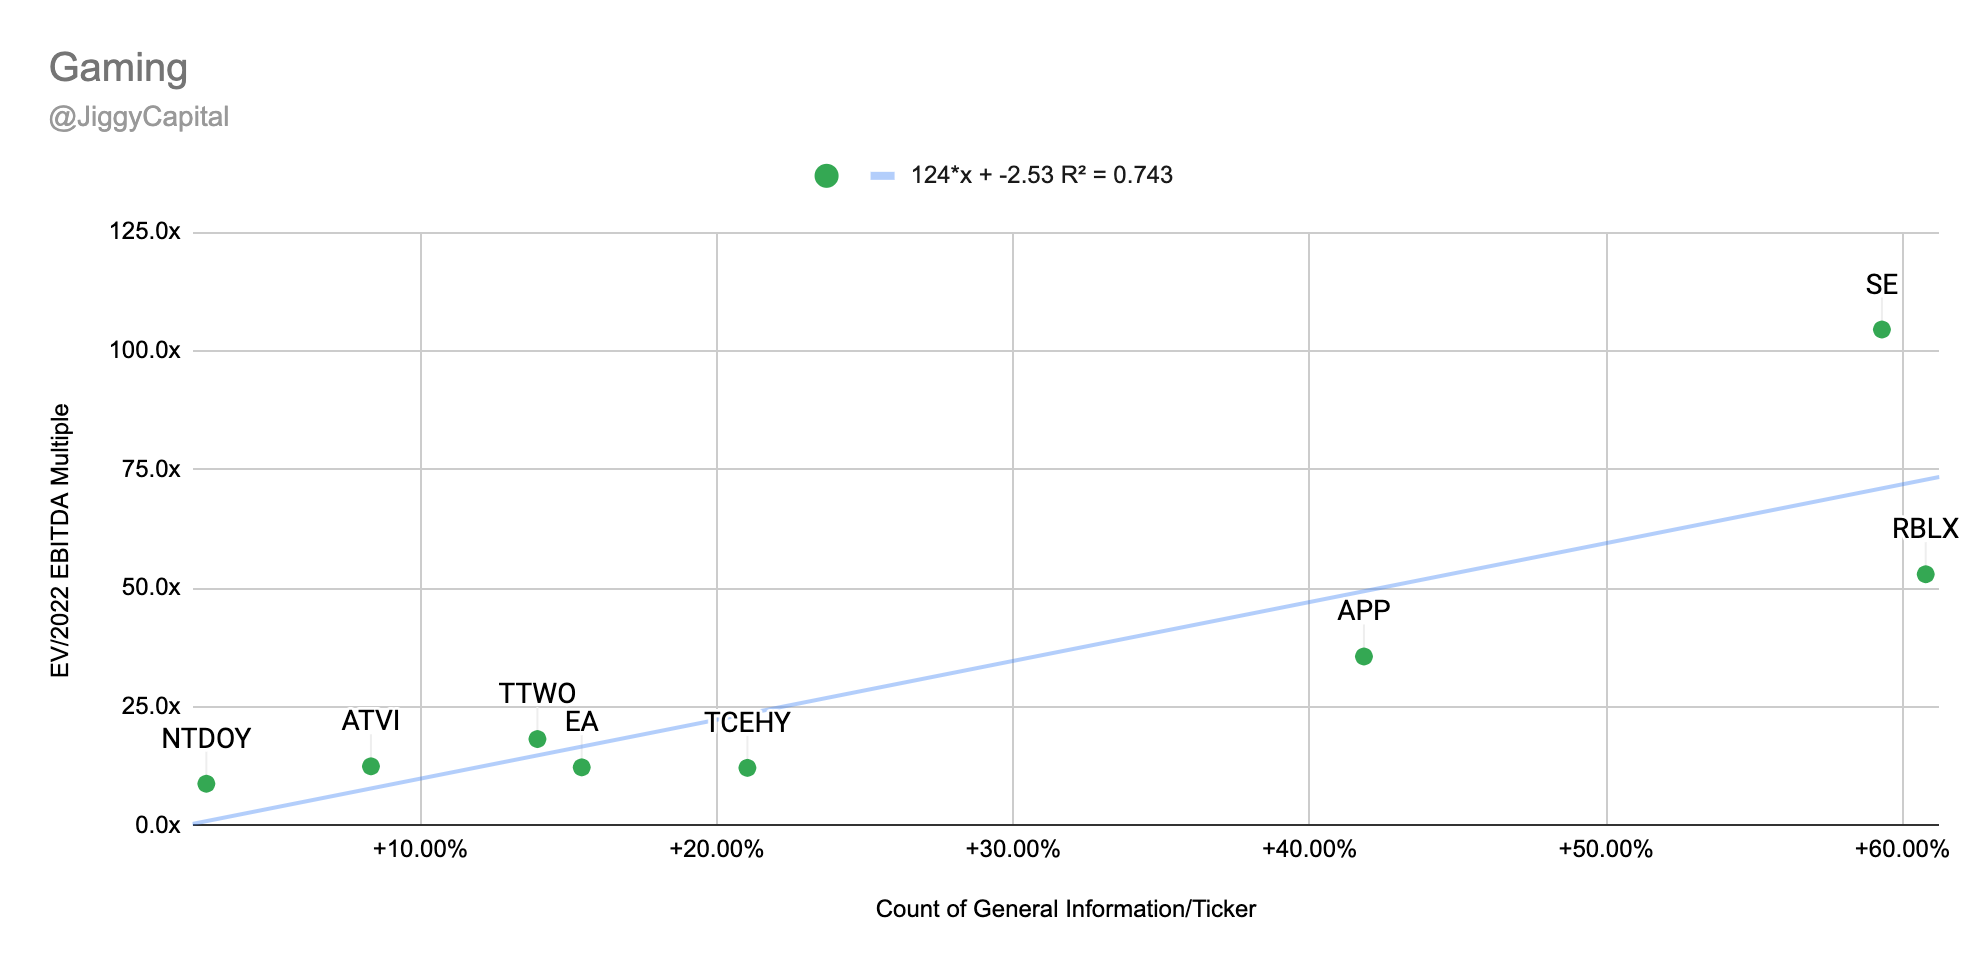
2021-2023 Revenue CAGR vs EV/2022 EBITDA Multiple:
Sector Stats:
Median Gross Margins: 67%
Median 2022e EBITDA Margin: 27%
Median 2021-2023 Projected Revenue CAGR: 22%
Median EV/2022e GP Multiple: 8.0x
Median EV/2022e EBITDA Multiple: 14.8x
Sector Highlights:
Strongest Gross Margins: Skillz (95%)
Strongest 2022e EBITDA Margins: Activision Blizzard (45%)
Strongest 2021-2023 Projected Revenue CAGR: Roblox (61%)
Weakest Gross Margins: Sea (31%)
Weakest 2022e EBITDA Margins: Skillz (-1%)
Weakest 2021-2023 Projected Revenue CAGR: Nintendo (-7%)
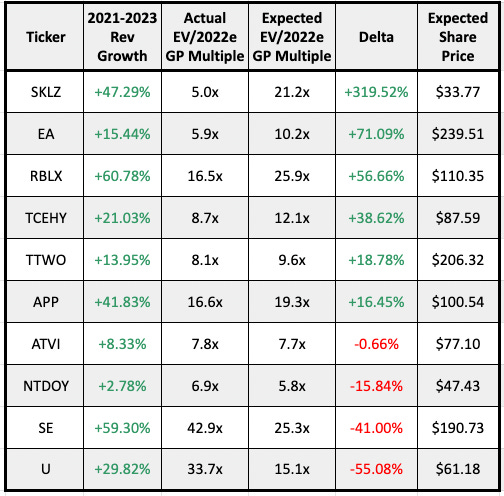
Scatter Plot Trendline Error Percentage:
“Undervalued”:
Gross Profit: Skillz (+320% Upside)
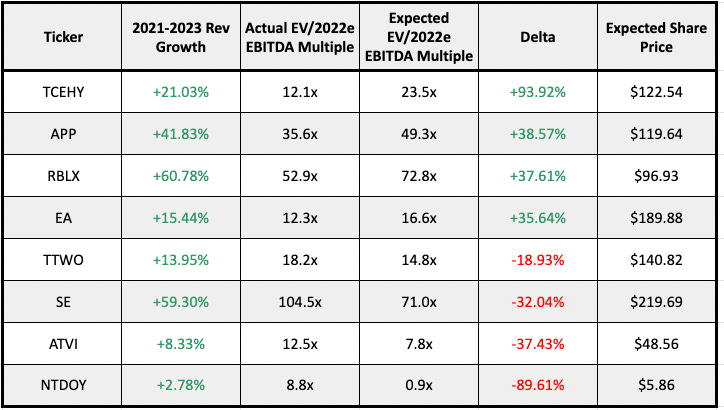
EBITDA: Tencent (+93% Upside)
“Overvalued”:
Gross Profit: Unity (-55% Downside)
EBITDA: Nintendo (-89% Downside)
Full Data:
Gross Profit:
EBITDA:
My Take
Another small dataset so a little tough to judge, and I don’t have any really strong takes here. Nintendo is misleading since its projected for negative rev CAGR given the nature of trendlines. Roblox stands out the most for me.
iGaming
Companies looked at: Draftkings (DKNG), Genius Sports (GENI), MGM Resorts (MGM), Evolution (EVVTY), Penn National Gaming (PENN), Paysafe (PSFE), Rush Street Interactive (RSI)
Scatter Plots:
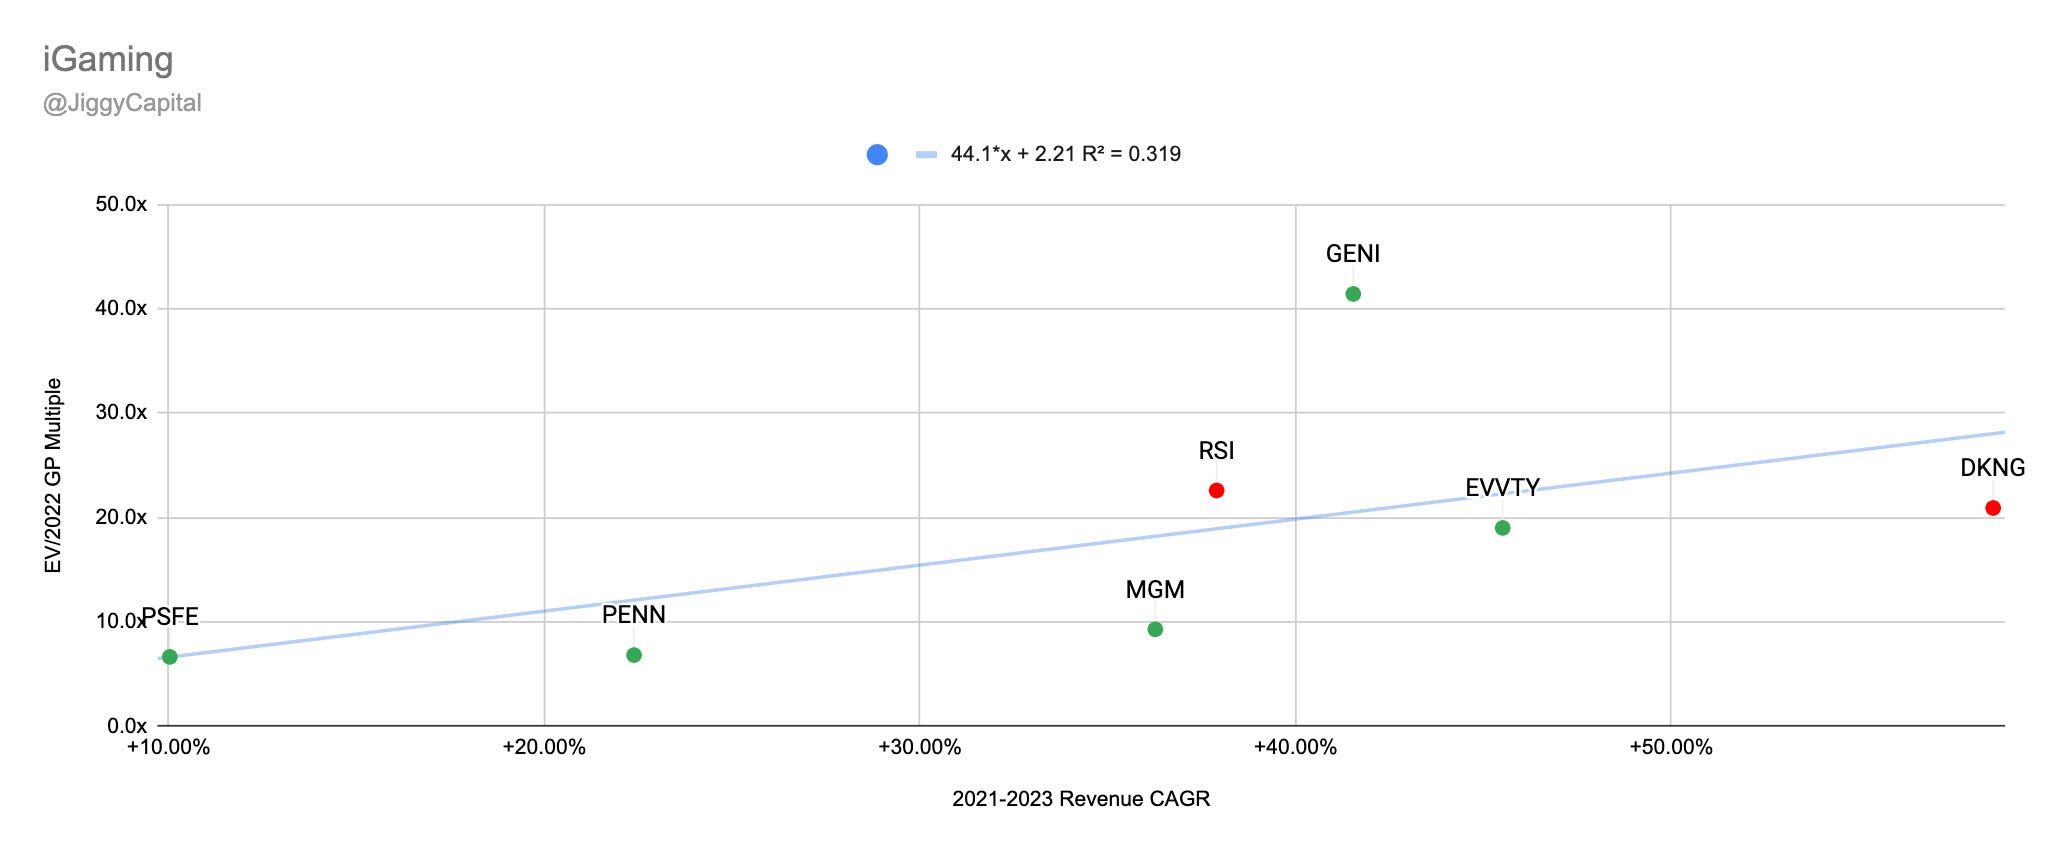
2021-2023 Revenue CAGR vs EV/2022 Gross Profit Multiple:
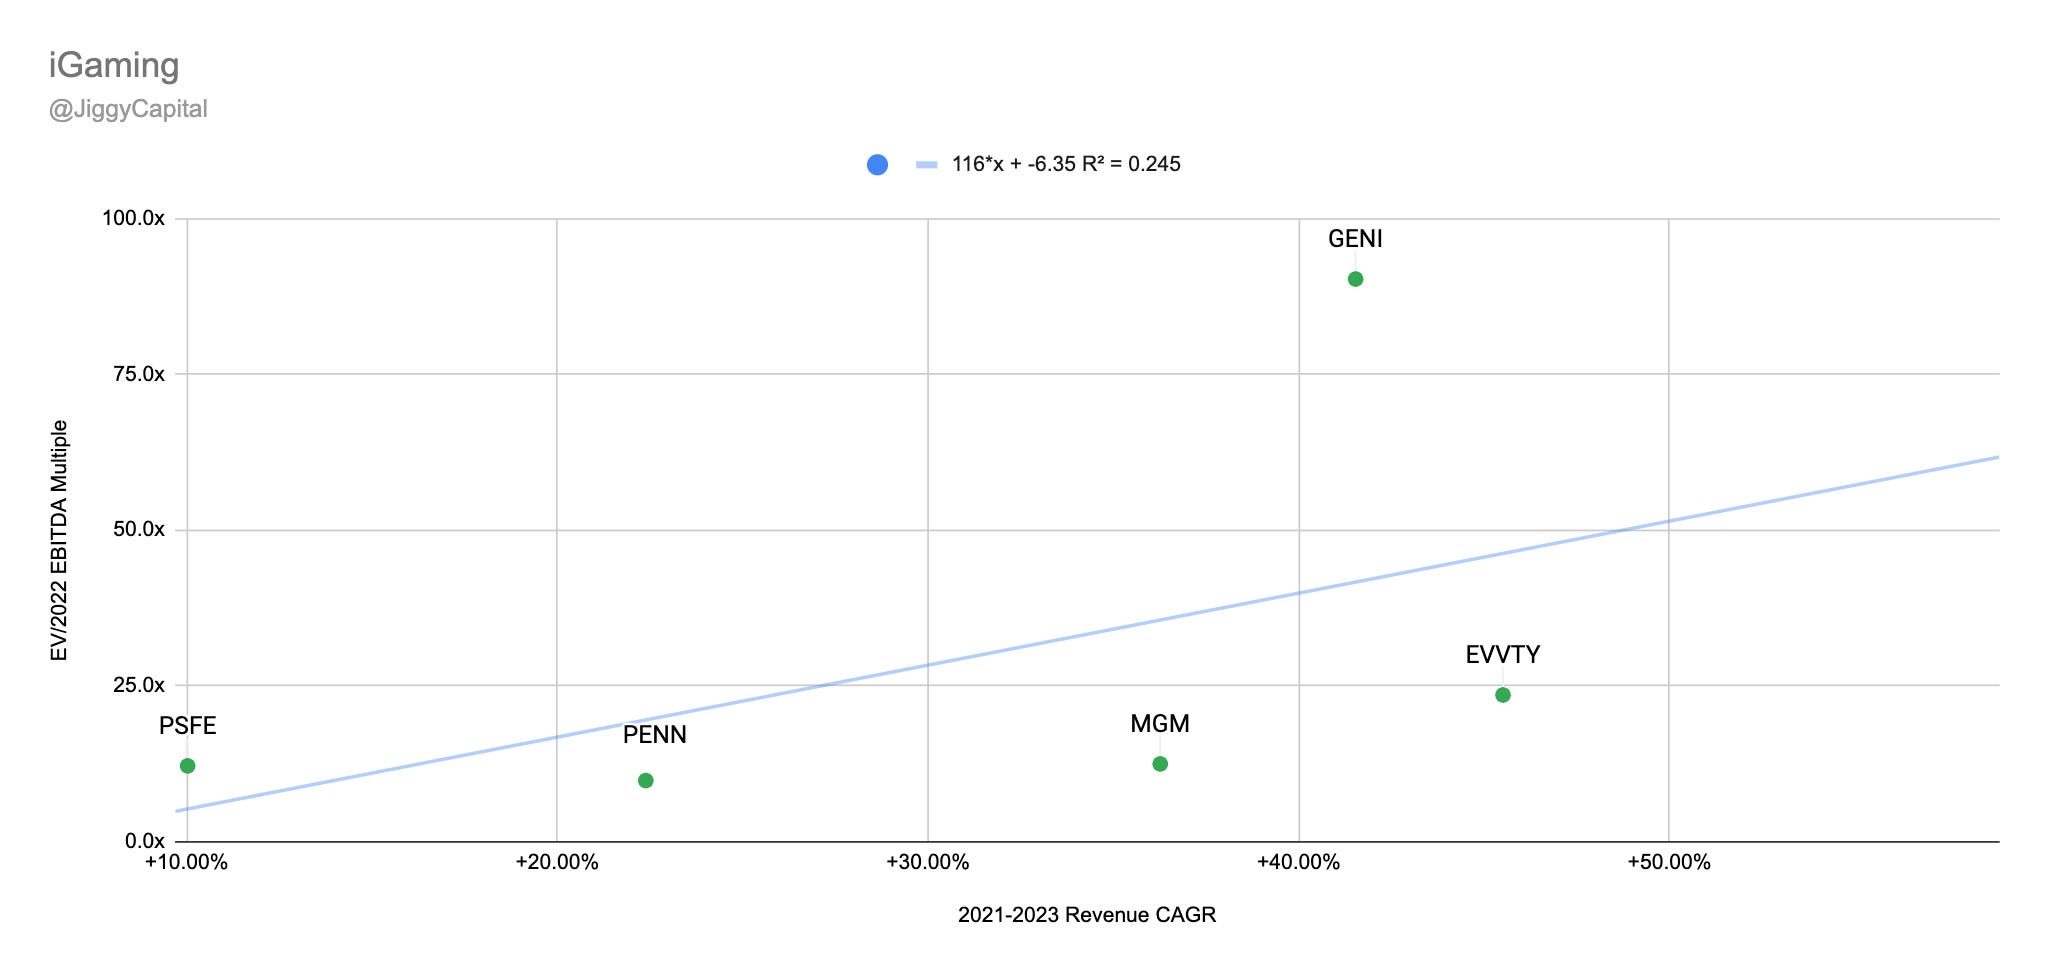
2021-2023 Revenue CAGR vs EV/2022 EBITDA Multiple:
Sector Stats:
Average Gross Margins: 47%
Average 2022e EBITDA Margin: 20%
Average 2021-2023 Projected Revenue CAGR: 36%
Average EV/2022e GP Multiple: 17.7x
Average EV/2022e EBITDA Multiple: 28.5x
Sector Highlights:
Strongest Gross Margins: Evolution (86%)
Strongest 2022e EBITDA Margins: Evolution (69%)
Strongest 2021-2023 Projected Revenue CAGR: DraftKings (59%)
Weakest Gross Margins: Genius Sports (26%)
Weakest 2022e EBITDA Margins: DraftKings (-22%)
Weakest 2021-2023 Projected Revenue CAGR: Paysafe (10%)
Scatter Plot Trendline Error Percentage:
“Undervalued”:
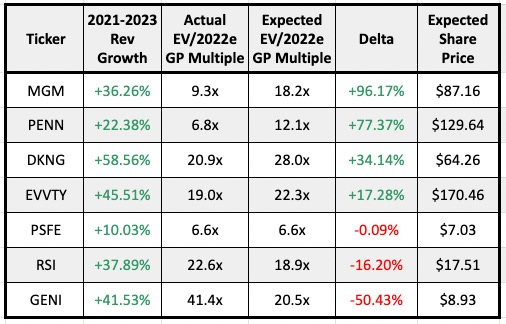
Gross Profit: MGM Resorts (+96% Upside)
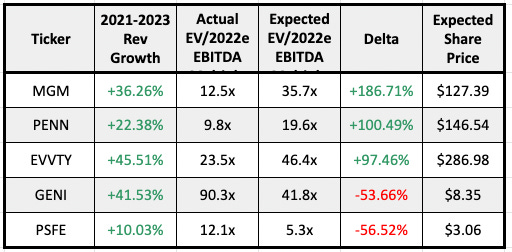
EBITDA: MGM Resorts (+186% Upside)
“Overvalued”:
Gross Profit: Genius Sports (-50% Downside)
EBITDA: Paysafe (-56% Downside)
Full Data:
Gross Profit:
EBITDA:
My Take
Wowza Evolution. I don’t know much about them but those margins are amazing and it feels rightly valued. Intersting stock if I didn’t tell myself I wouldn’t touch iGaming sector due to high CAC costs and an incredibly competitive field where I think winner will take all (maybe that’s a hot take, most at the least). Genius Sports margins aren’t impressive at all and is priced at quite the premium. Hopefully be next quarter we get some consensus estimates for GENI competitor Sportradar (recent IPO).
Platform
Companies looked at: Airbnb (ABNB), Grab (AGC), Amazon (AMZN), Angi (ANGI), Alibaba (BABA), Bumble (BMBL), Chegg (CHGG), DoorDash (DASH), Doximity (DOCS), Duolingo (DUOL), eBay (EBAY), Etsy (ETSY), Facebook (FB), Fiverr (FVRR), Alphabet (GOOG), Weedmaps (MAPS), Mercadolibre (MELI), Pinterest (PINS), Poshmark (POSH), Redfin (RDFN), StitchFix (SFIX), Snap (SNAP), Twitter (TWTR), Uber (UBER), Upwork (UPWK), Zillow Group (Z), Zoominfo (ZI), Ziprecruiter (ZIP)
Scatter Plots:
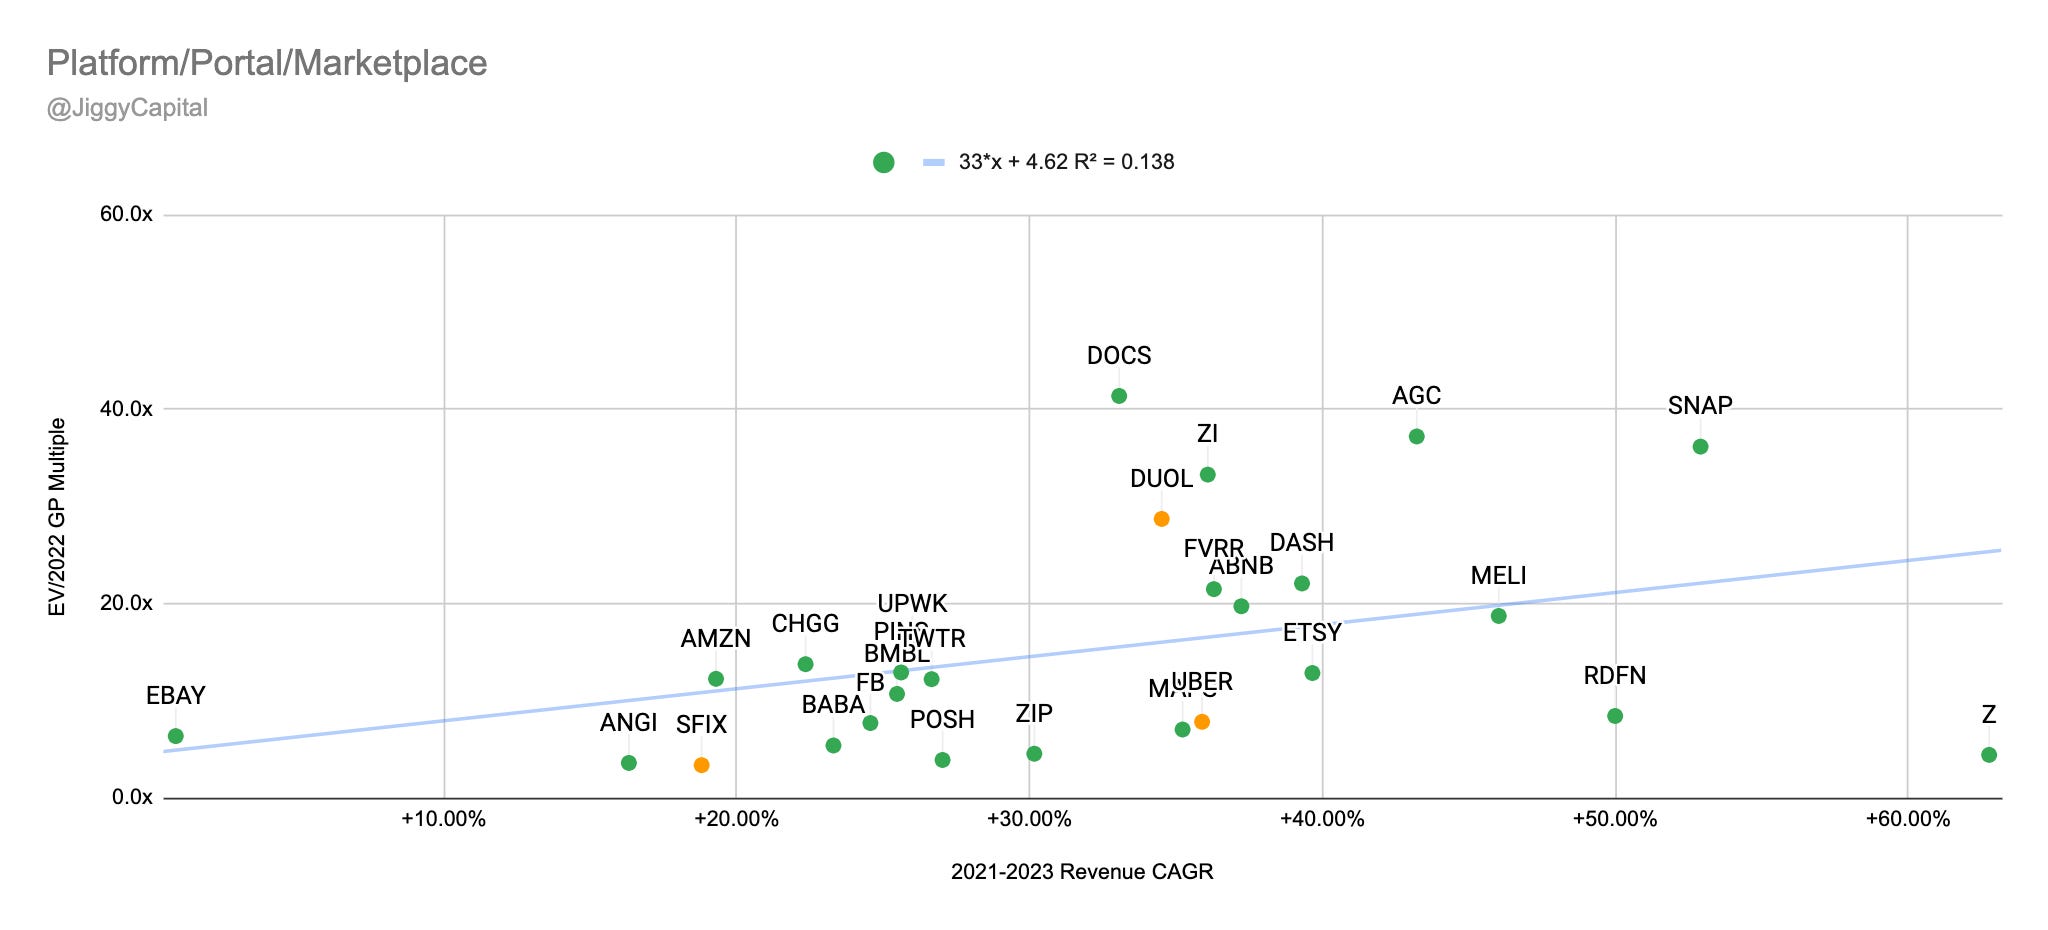
2021-2023 Revenue CAGR vs EV/2022 Gross Profit Multiple:
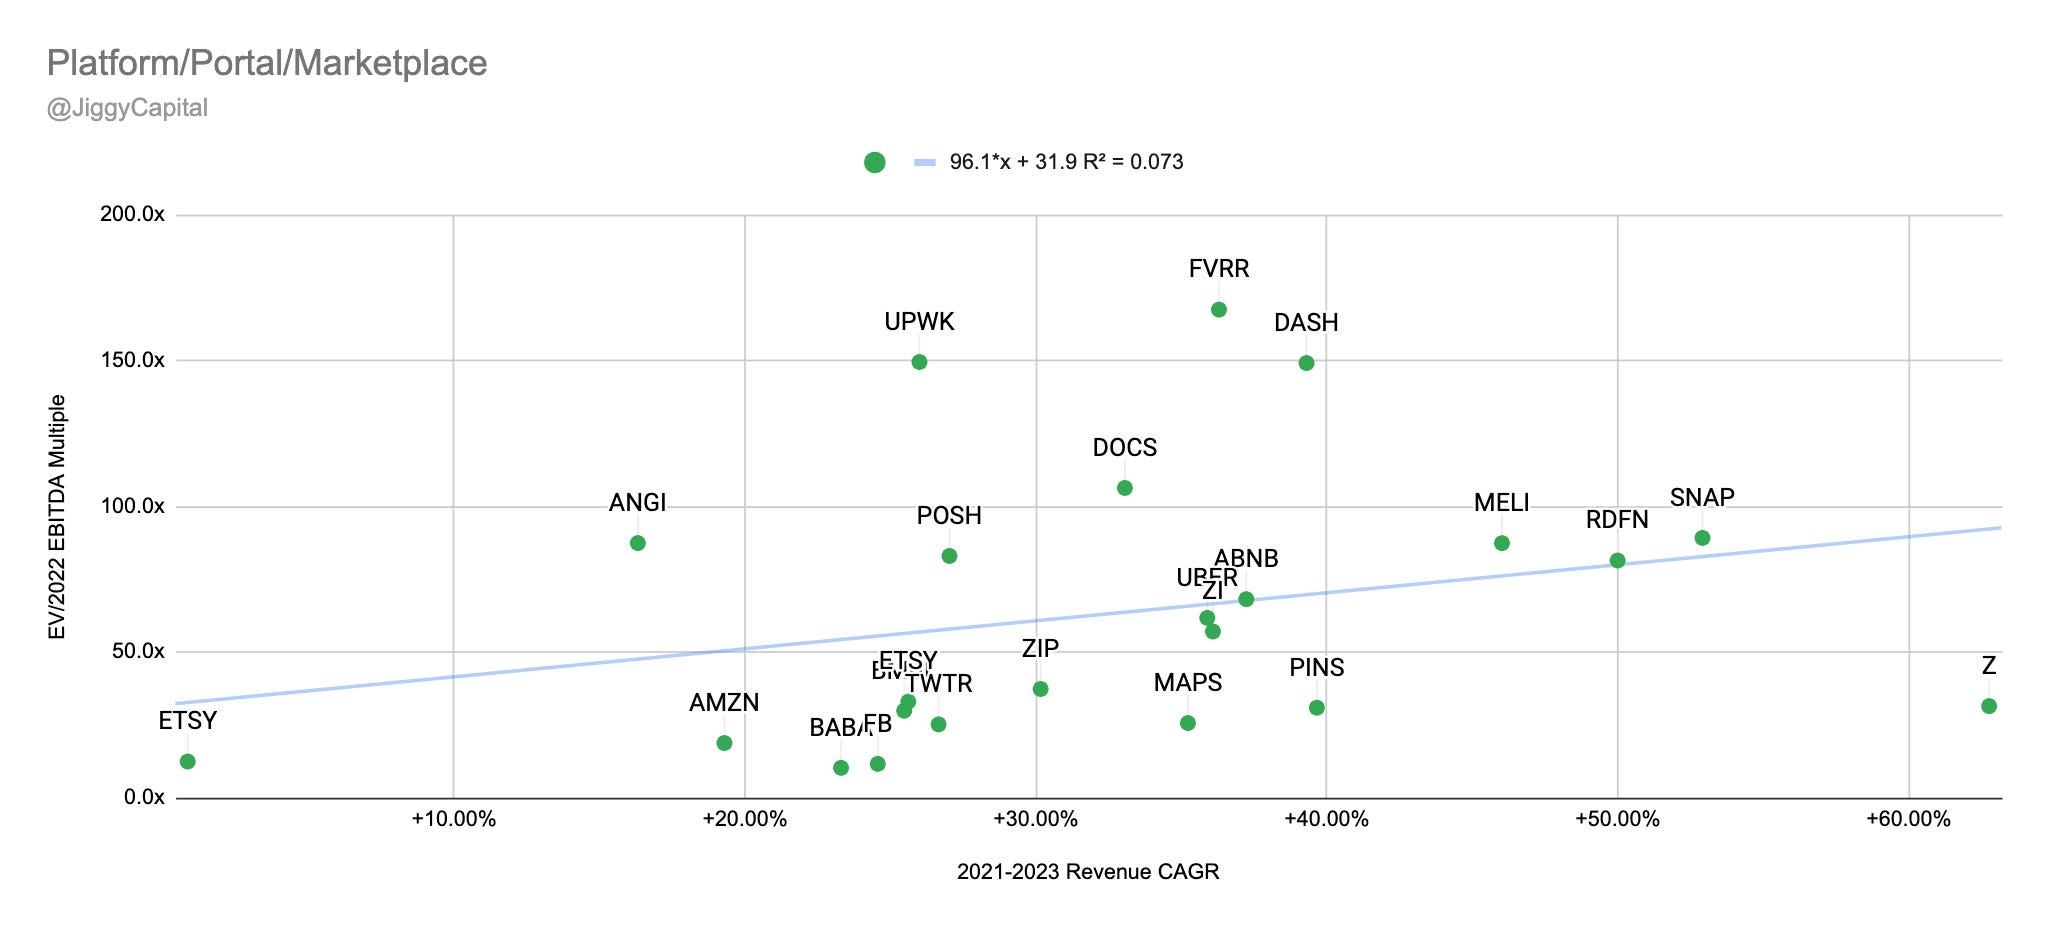
2021-2023 Revenue CAGR vs EV/2022 EBITDA Multiple:
Sector Stats:
Median Gross Margins: 72%
Median 2022e EBITDA Margin: 16%
Median 2021-2023 Projected Revenue CAGR: 34%
Median EV/2022e GP Multiple: 12.3x
Median EV/2022e EBITDA Multiple: 60.8x
Sector Highlights:
Strongest Gross Margins: Weedmaps (96%)
Strongest 2022e EBITDA Margins: Facebook (53%)
Strongest 2021-2023 Projected Revenue CAGR: Zillow (45%)
Weakest Gross Margins: Amazon (24%)
Weakest 2022e EBITDA Margins: StitchFix (-2%)
Weakest 2021-2023 Projected Revenue CAGR: eBay (1%)
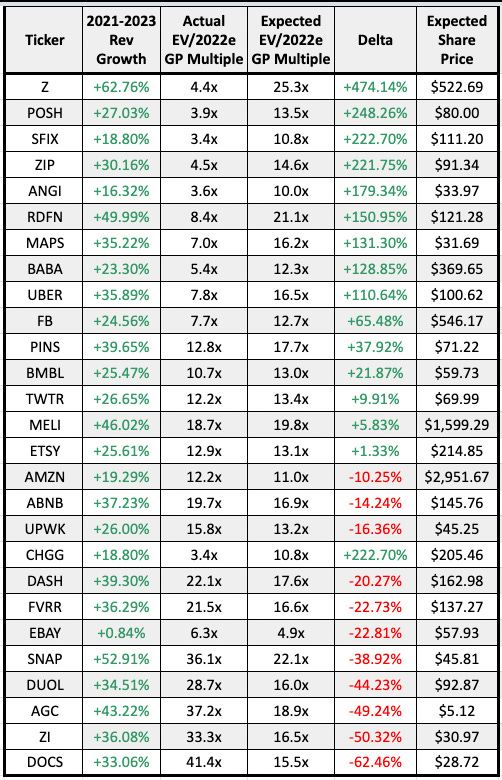
Scatter Plot Trendline Error Percentage:
“Undervalued”:
Gross Profit: Zillow (+474% Upside)
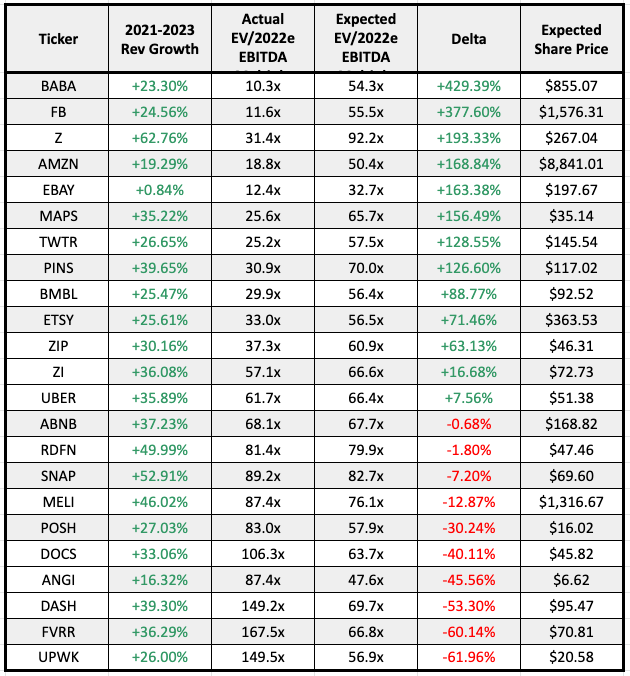
EBITDA: Alibaba (+429% Upside)
“Overvalued”:
Gross Profit: Doximity (-62% Downside)
EBITDA: Upwork (-62% Downside)
Full Data:
Gross Profit:
EBITDA:
My Take
This is an extremely broad group so you shouldn’t put a ton of stock into it but I think it was the best way to bundle some of these names into a comparison. ZoomInfo bottom line margins are amazing, even if it looks “overvalued” on a gross profit basis. Interesting that the two gig economy marketplace companies (FVRR and UPWK) are “overvalued” on a EBITDA basis.
Real Estate
Companies looked at: Compass (COMP), eXp (EXPI), Fathom (FTHM), Opendoor (OPEN), Redfin (RDFN), Zillow (Z)
Scatter Plots:
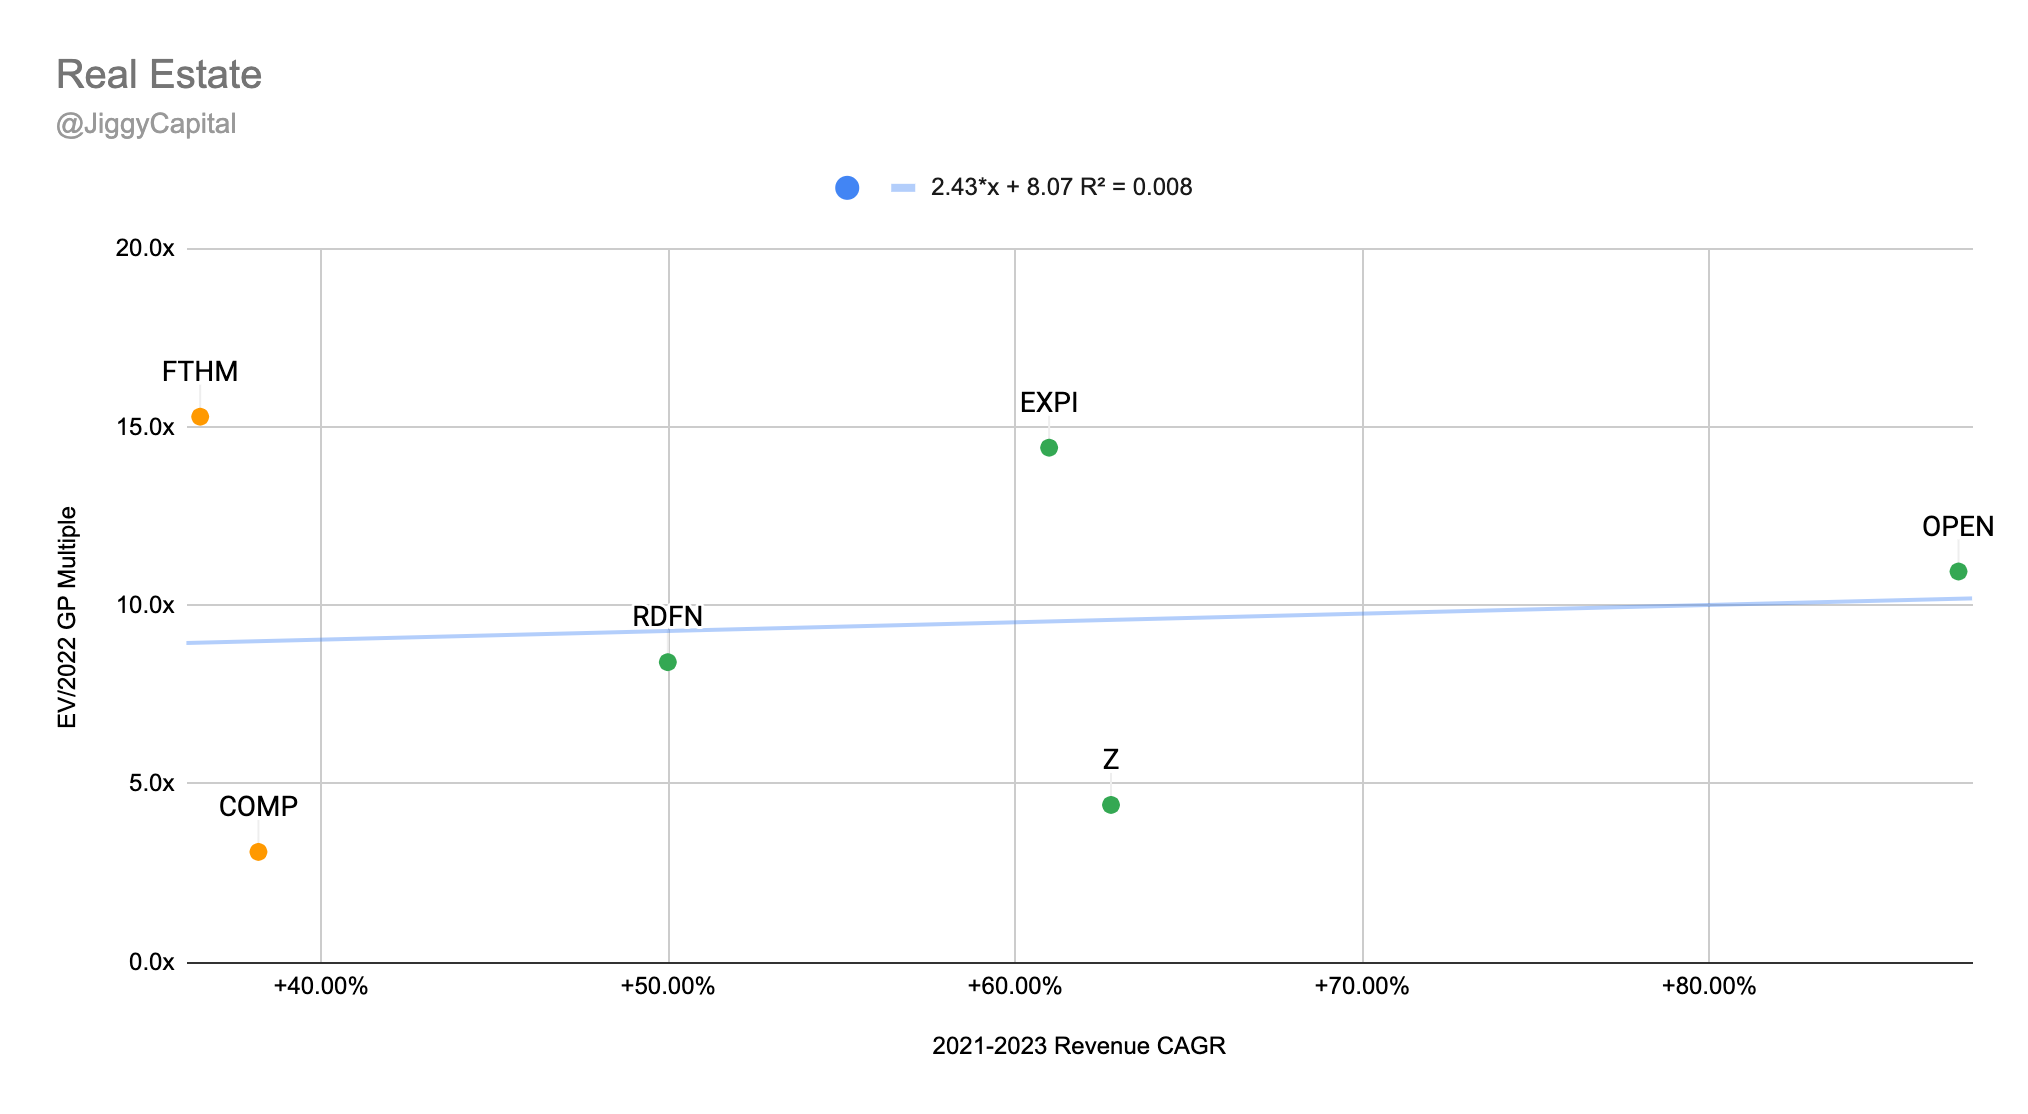
2021-2023 Revenue CAGR vs EV/2022 Gross Profit Multiple:
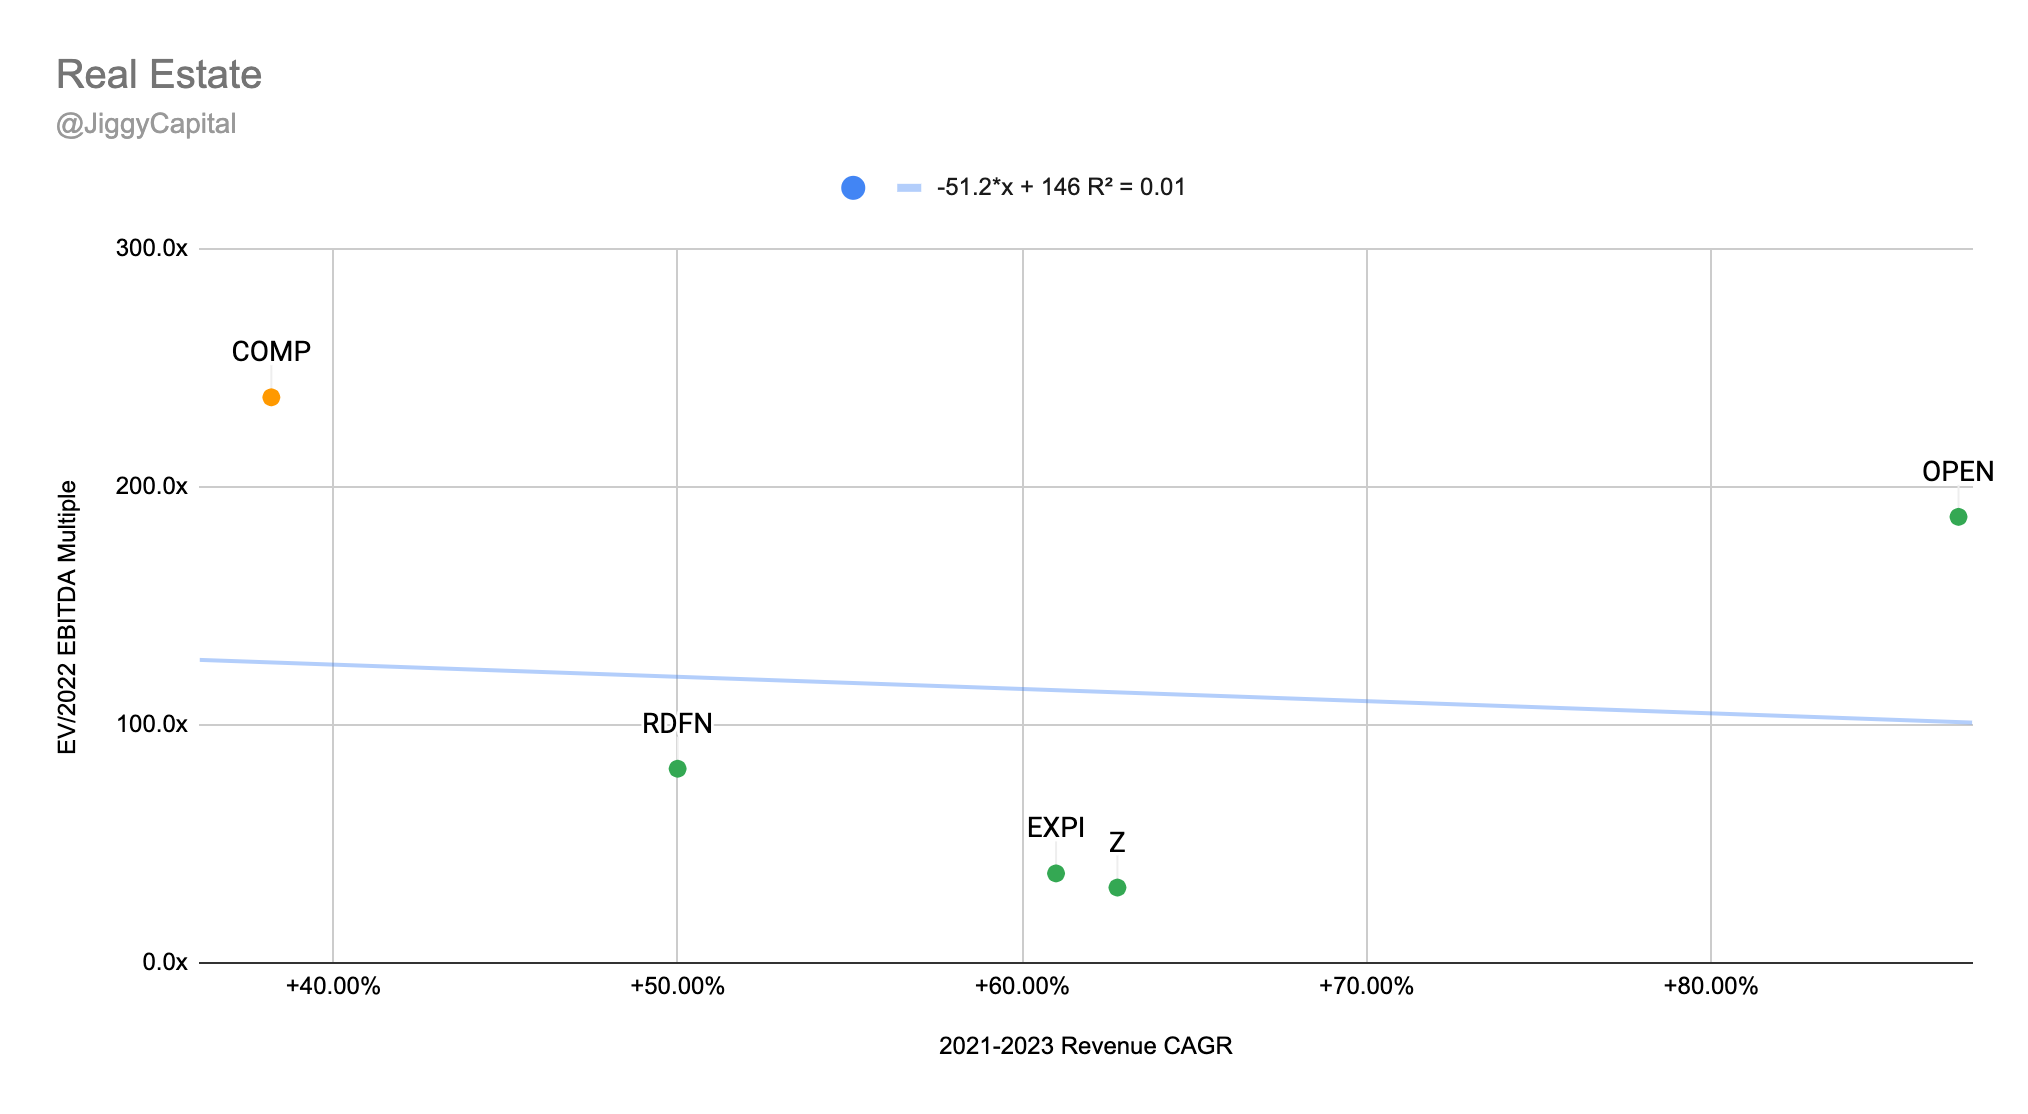
2021-2023 Revenue CAGR vs EV/2022 EBITDA Multiple:
Sector Stats:
Average Gross Margins: 19%
Average 2022e EBITDA Margin: 2%
Average 2021-2023 Projected Revenue CAGR: 56%
Average EV/2022e GP Multiple: 9.2x
Average EV/2022e EBITDA Multiple: 109.8x
Sector Highlights:
Strongest Gross Margins: Zillow Group (47%)
Strongest 2022e EBITDA Margins: Zillow (7%)
Strongest 2021-2023 Projected Revenue CAGR: Opendoor (87%)
Weakest Gross Margins: Fathom (6%)
Weakest 2022e EBITDA Margins: Fathom (-1%)
Weakest 2021-2023 Projected Revenue CAGR: Compass (38%)
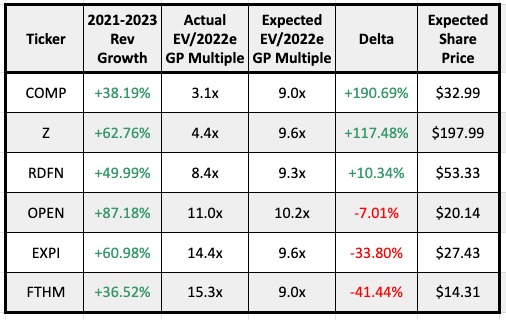
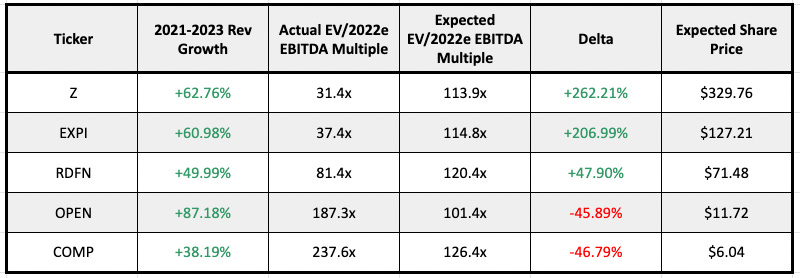
Scatter Plot Trendline Error Percentage:
“Undervalued”:
Gross Profit: Compass (+191% Upside)
EBITDA: Zillow Group (+262% Upside)
“Overvalued”:
Gross Profit: Fathom (-41% Downside)
EBITDA: Compass (-47% Downside)
Full Data:
Gross Profit:
EBITDA:
My Take
This was the other group I was referring to in the Big Tech section where the trendline isn’t a very pretty one (in this case for EBITDA multiple comps). Interesting to see both Opendoor and Redfin so close to the trendline of what is expected of them to be valued at on the Gross Profit scatter plot.
Retail
Companies looked at: Axon (AXON), Best Buy (BBY), Celsius (CELH), Costco (COST), Cricut (CRCT), Crocs (CROX), Corsair Gaming (CRSR), CVS Health (CVS), Camping World (CWH), Walt Disney (DIS), Dicks Sporting Goods (DKS), Drive Shack (DS), Callaway Golf (ELY), Figs (FIGS), GameStop (GME), Acushnet (GOLF), Garmin (GRMN), Home Depot (HD), Turtle Beach (HEAR), iRobot (IRBT), Joann (JOAN), Lovesac (LOVE), Lowe’s (LOW), Lululemon (LULU), Purple Innovation (PRPL), Peloton (PTON), Restoration Hardware (RH), Target (TGT), TJX Companies (TJX), Walmart (WMT), Yeti (YETI)
Scatter Plots:
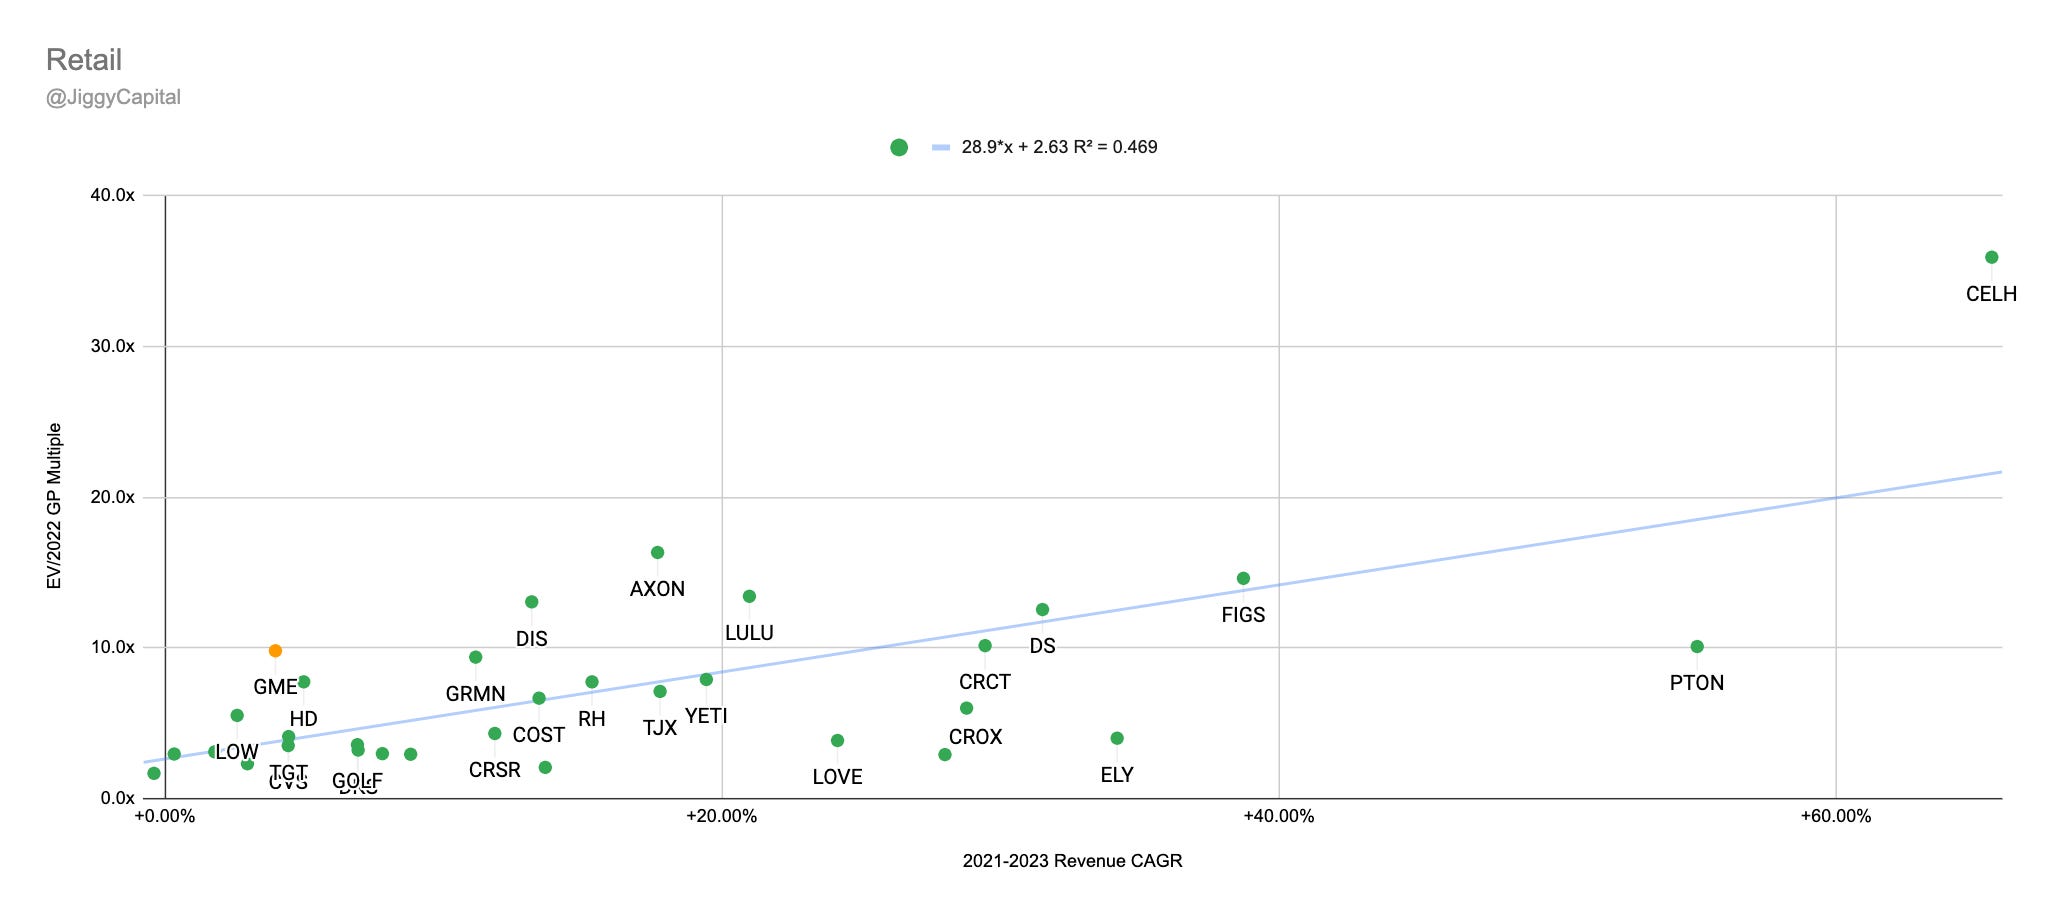
2021-2023 Revenue CAGR vs EV/2022 Gross Profit Multiple:
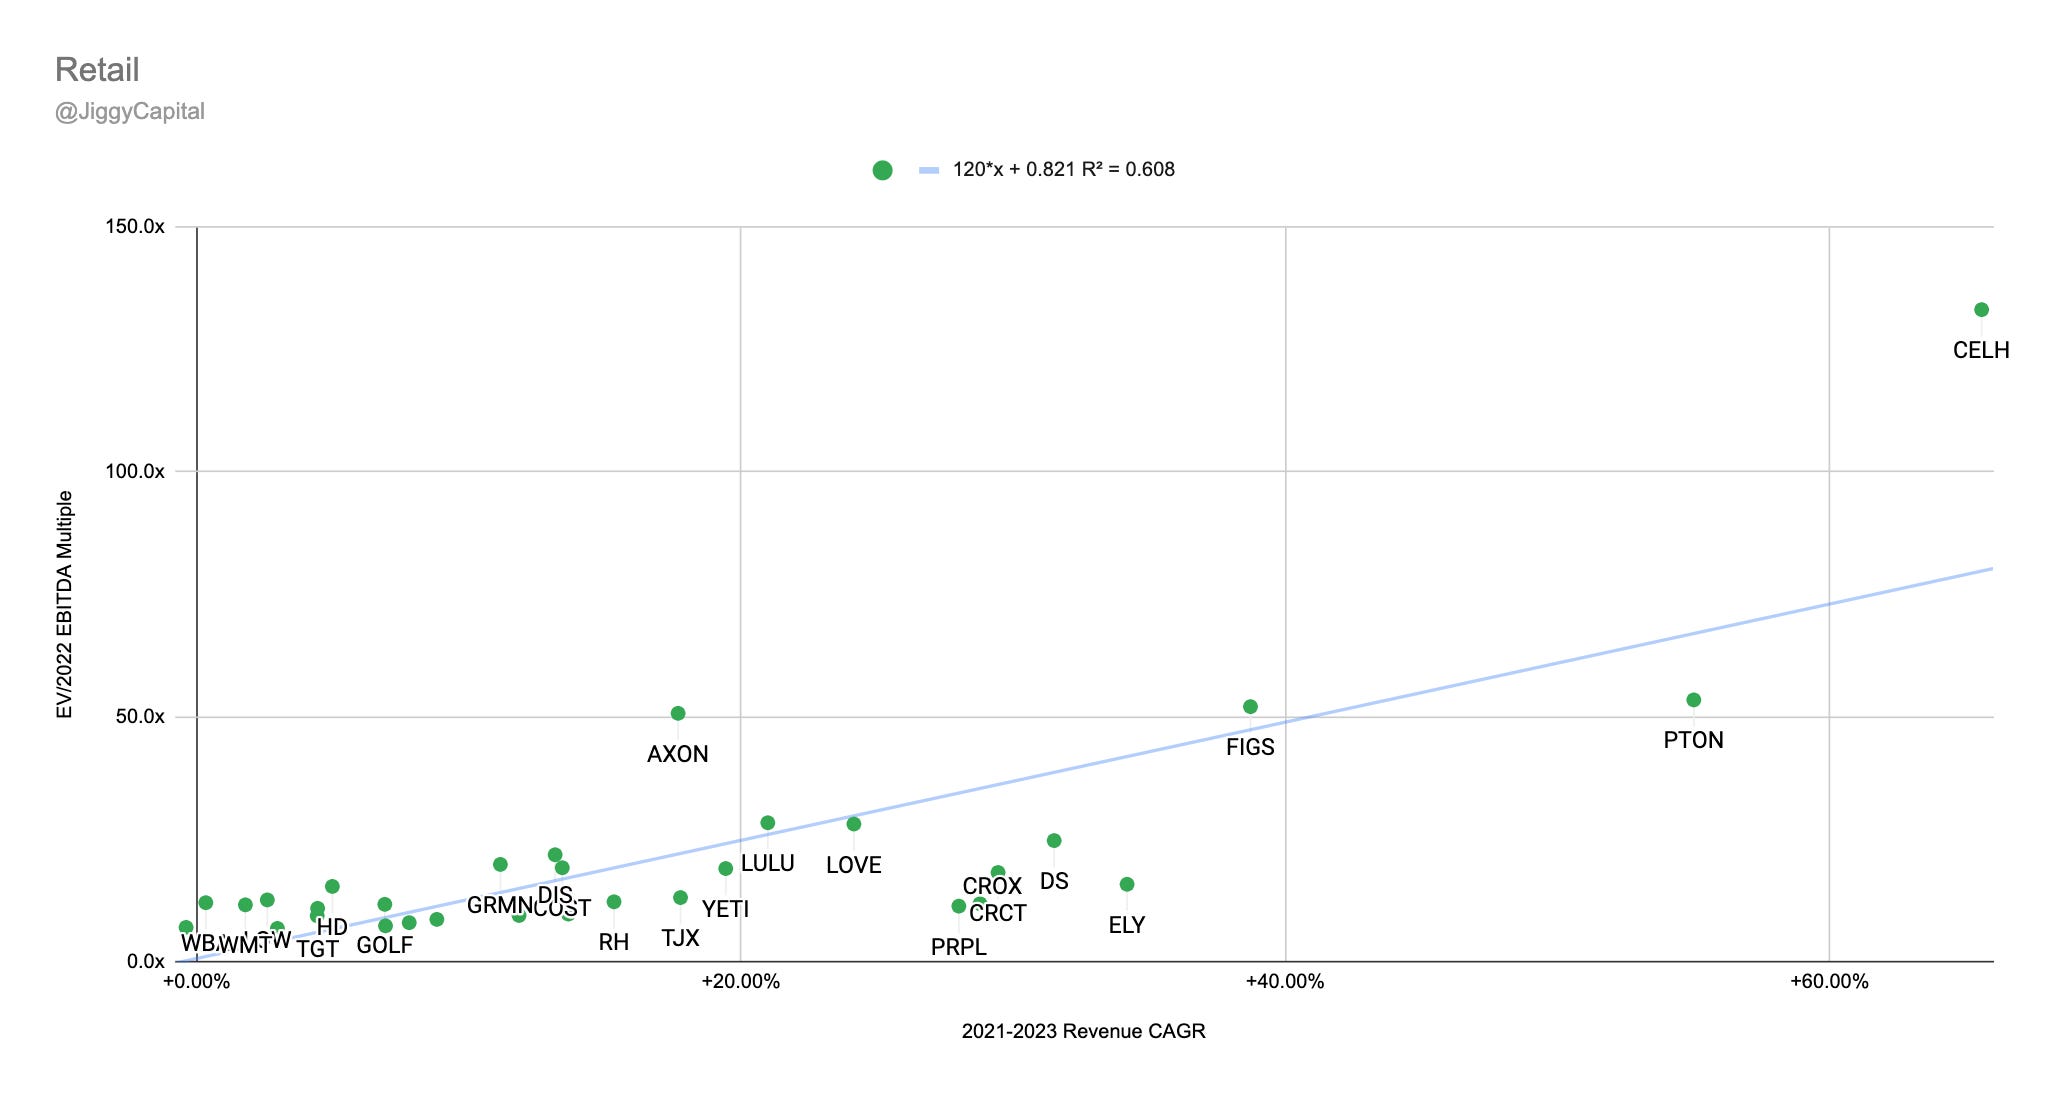
2021-2023 Revenue CAGR vs EV/2022 EBITDA Multiple:
Sector Stats:
Median Gross Margins: 35%
Median 2022e EBITDA Margin: 12%
Median 2021-2023 Projected Revenue CAGR: 13%
Median EV/2022e GP Multiple: 5.5x
Median EV/2022e EBITDA Multiple: 12.7x
Sector Highlights:
Strongest Gross Margins: Figs (72%)
Strongest 2022e EBITDA Margins: Restoration Hardware (29%)
Strongest 2021-2023 Projected Revenue CAGR: Celsius (66%)
Weakest Gross Margins: Drive Shack (10%)
Weakest 2022e EBITDA Margins: GameStop (0%)
Weakest 2021-2023 Projected Revenue CAGR: Joann (0%)
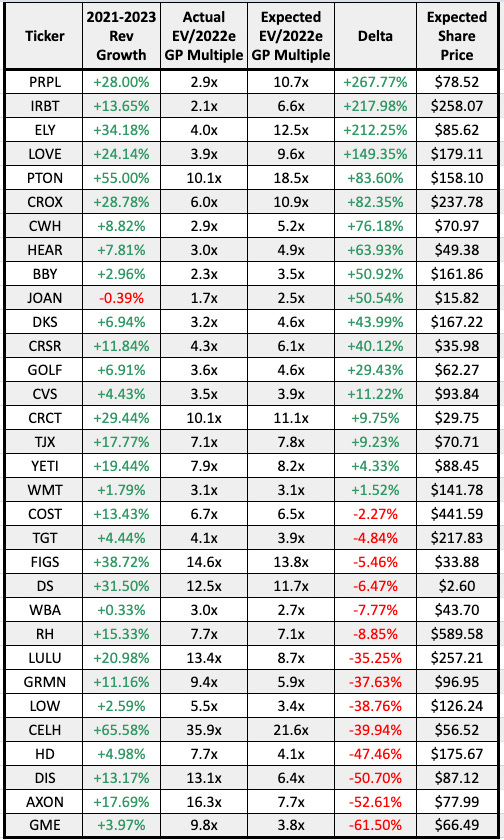
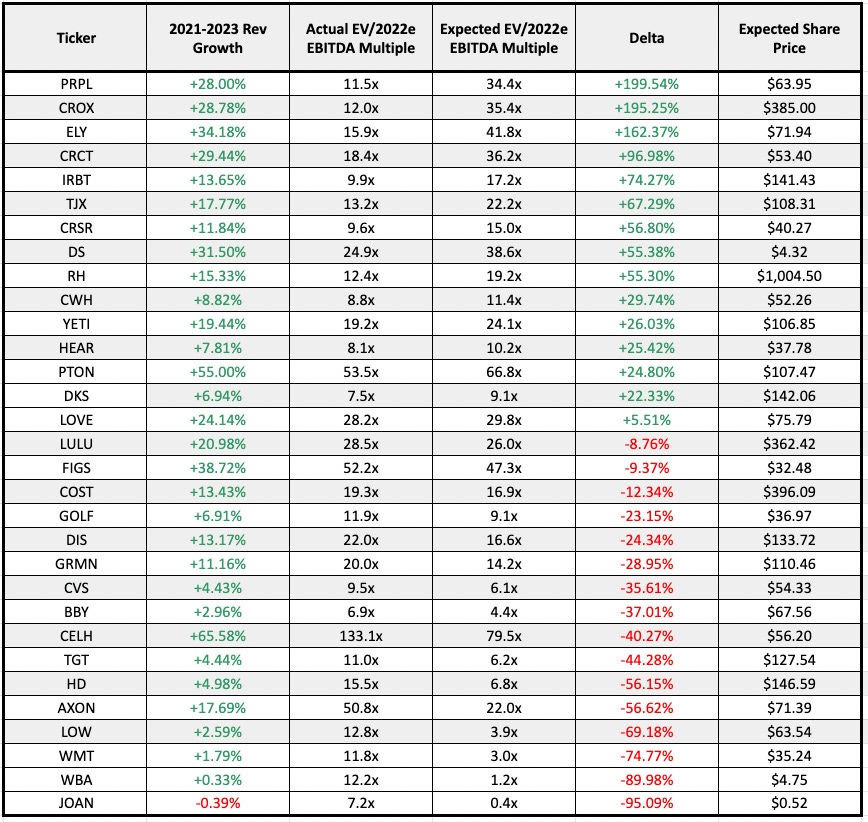
Scatter Plot Trendline Error Percentage:
“Undervalued”:
Gross Profit: Purple Innovation (+267% Upside)
EBITDA: Purple Innovation (+199% Upside)
“Overvalued”:
Gross Profit: Gamestop (-61% Downside)
EBITDA: Joann (-95% Downside)
Full Data:
Gross Profit:
EBITDA:
My Take
I don’t think you should give any weight to the trendline error with this group since so many are mature and not growing as much, but still paired with high flying growth stocks like Peloton and Celcius so it’s not a perfect marriage. Fun group of stocks to look at though! I’m a big fan of Restoration Hardware but have never owned.
Social Media
Companies looked at: Facebook (FB), Alphabet (GOOG), Pinterest (PINS), Snap (SNAP), Twitter (TWTR)
Scatter Plots:
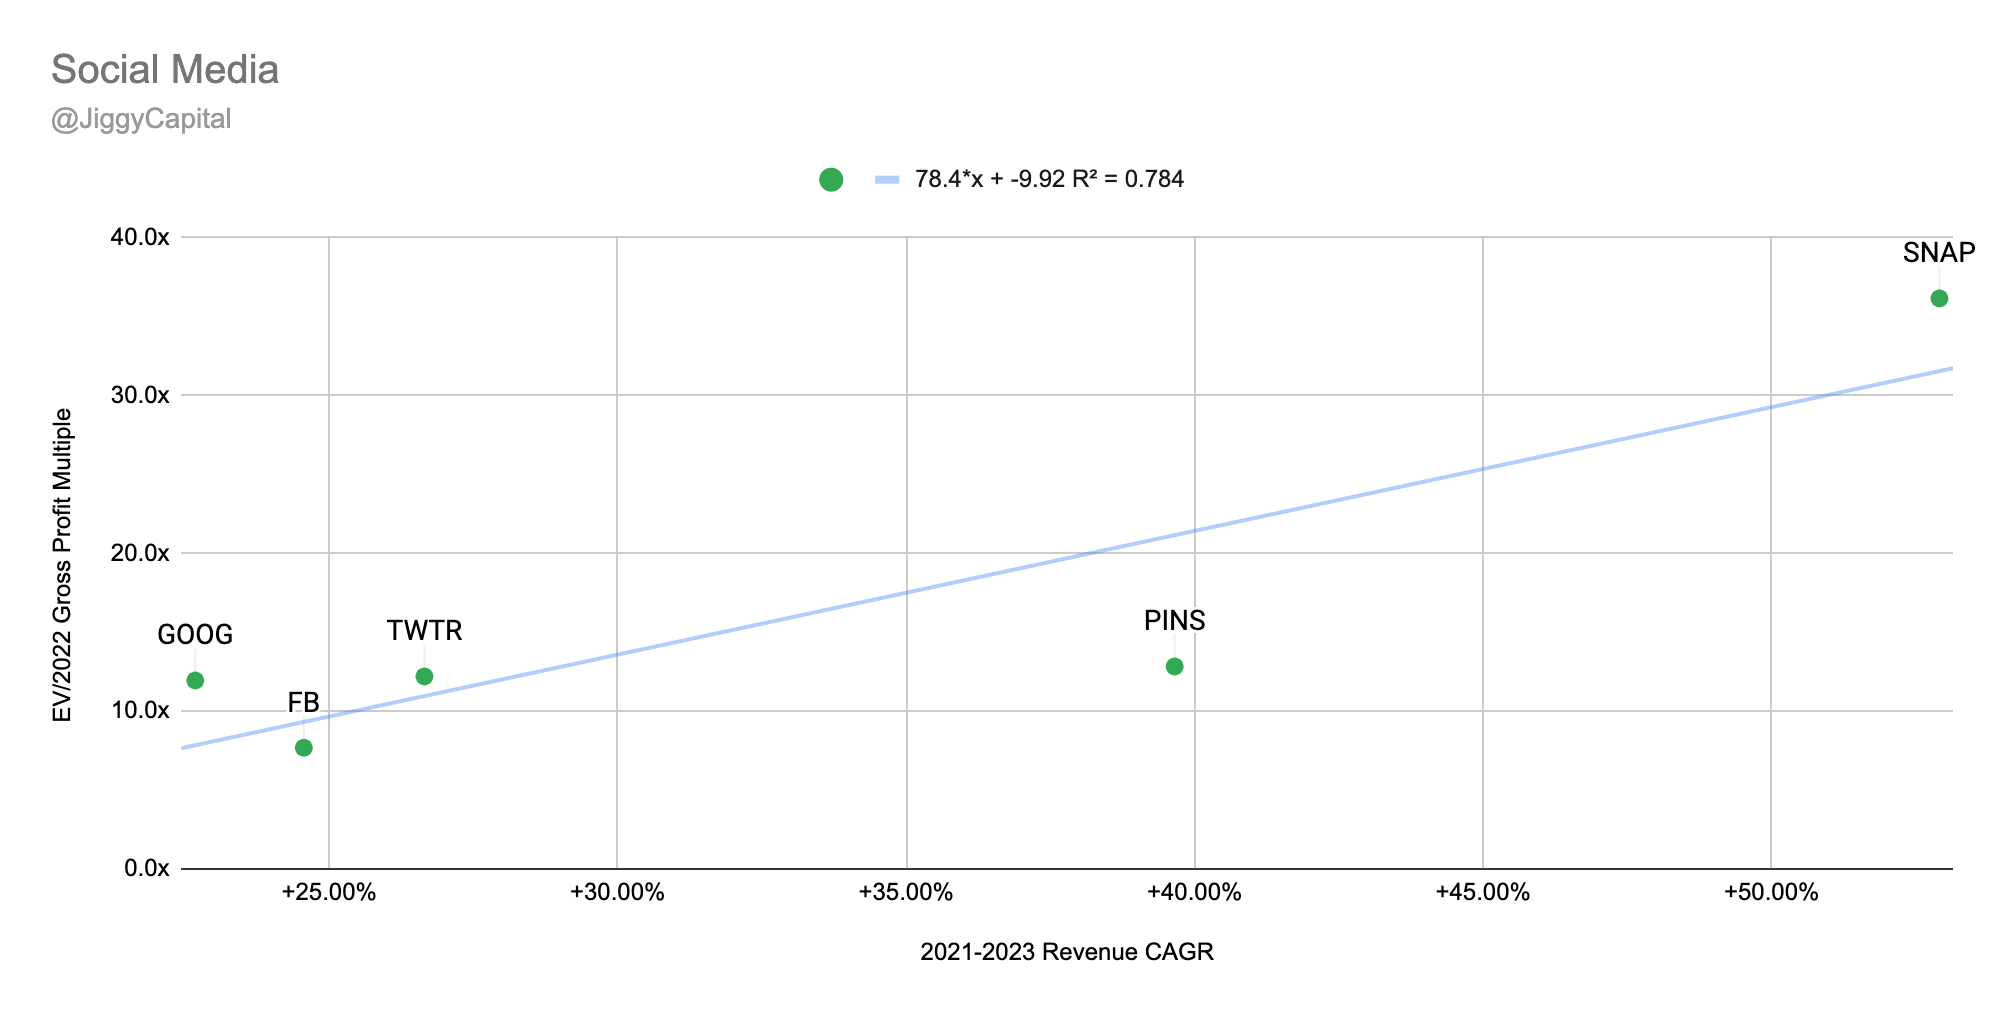
2021-2023 Revenue CAGR vs EV/2022 Gross Profit Multiple:
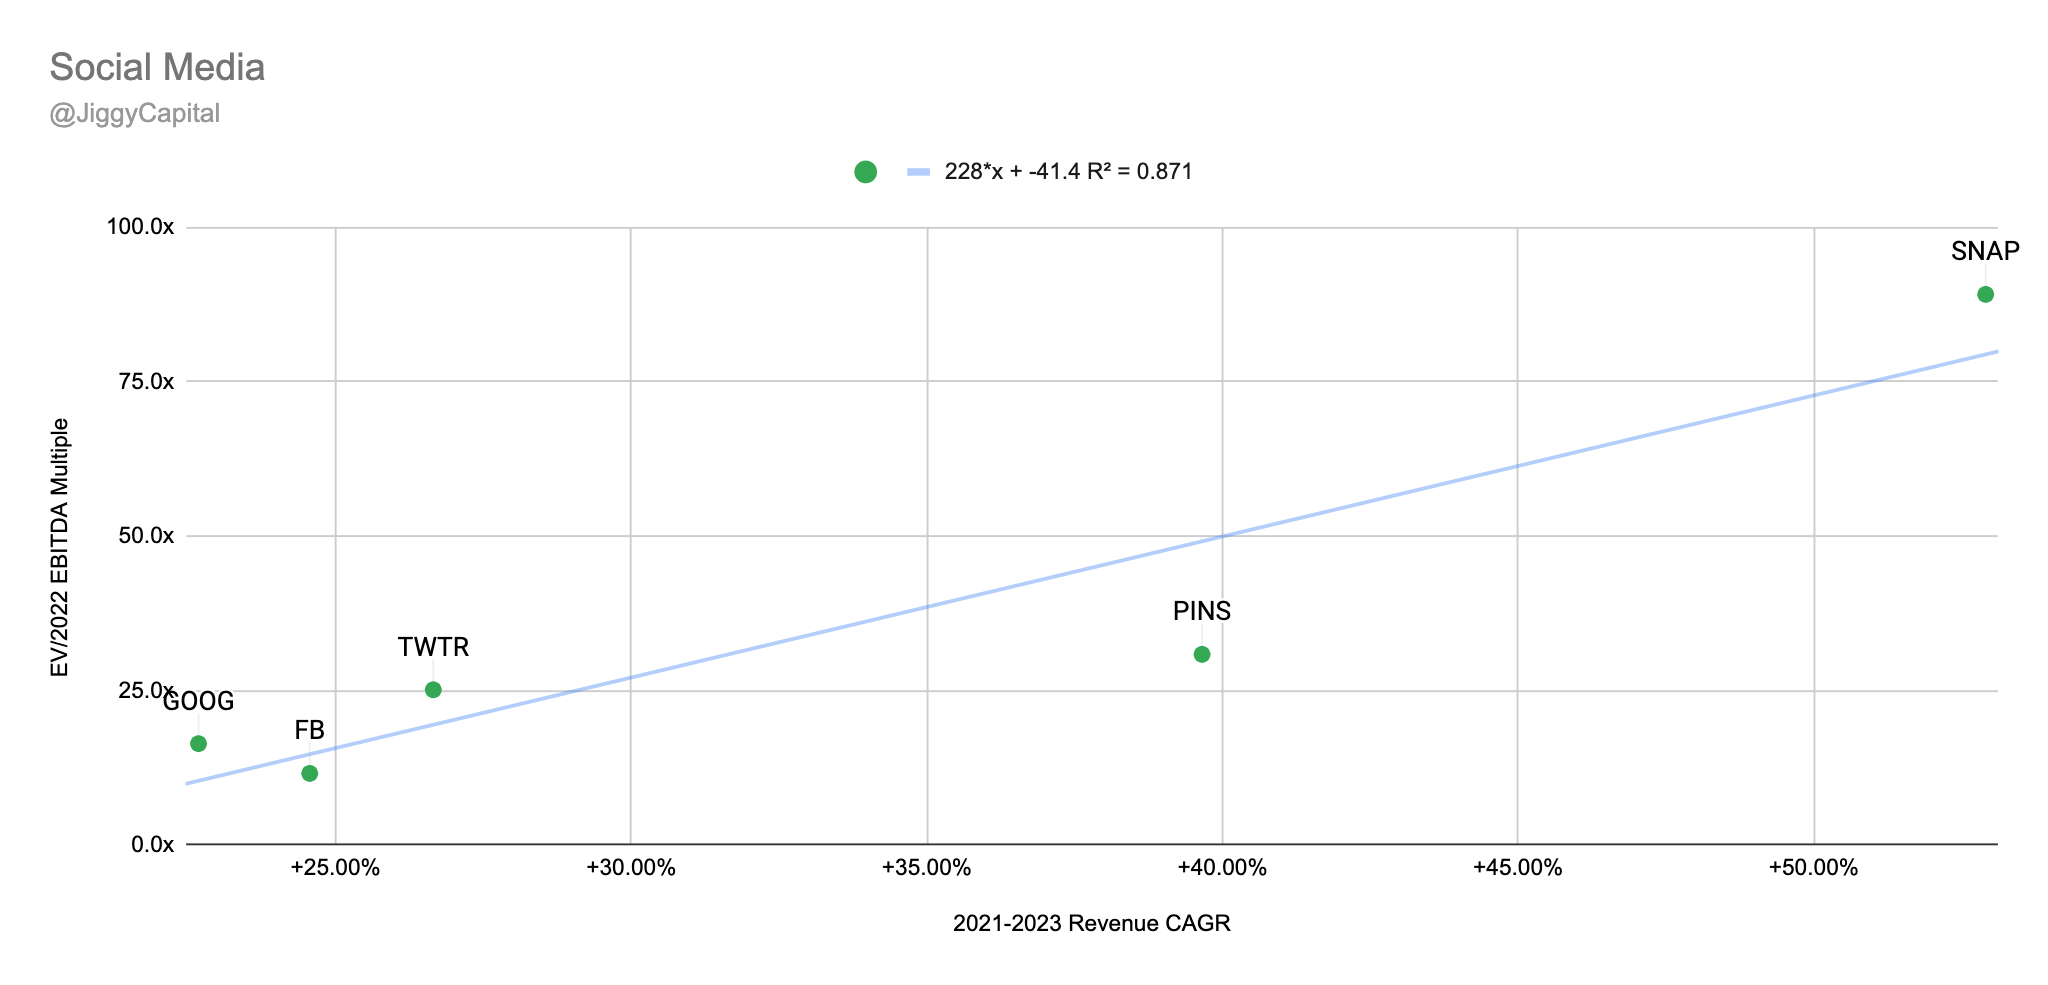
2021-2023 Revenue CAGR vs EV/2022 EBITDA Multiple:
Sector Stats:
Average Gross Margins: 65%
Average 2022e EBITDA Margin: 35%
Average 2021-2023 Projected Revenue CAGR: 33%
Average EV/2022e GP Multiple: 15.8x
Average EV/2022e EBITDA Multiple: 33.8x
Sector Highlights:
Strongest Gross Margins: Facebook (81%)
Strongest 2022e EBITDA Margins: Facebook (53%)
Strongest 2021-2023 Projected Revenue CAGR: Snap (53%)
Weakest Gross Margins: Snap (53%)
Weakest 2022e EBITDA Margins: Snap (21%)
Weakest 2021-2023 Projected Revenue CAGR: Alphabet (23%)
Scatter Plot Trendline Error Percentage:
“Undervalued”:
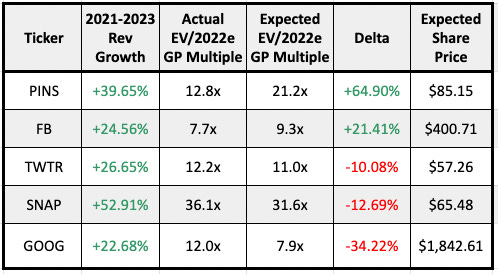
Gross Profit: Pinterest (+65% Upside)
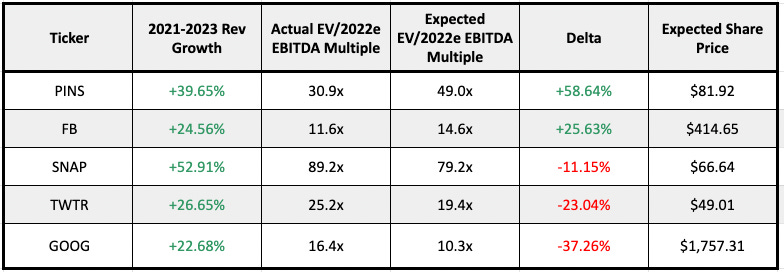
EBITDA: Pinterest (+58% Upside)
“Overvalued”:
Gross Profit: Alphabet (-34% Downside)
EBITDA: Alphabet (-37% Downside)
Full Data:
Gross Profit:
EBITDA:
My Take
I also wouldn’t take much away from this group! Just thought it was interesting to look at the scatter plots and I find it amusing how their order doesn’t change from GP to EBITDA multiple analysis.
Software
Companies looked at: Apple (AAPL), Adobe (ADBE), Autodesk (ADSK), Akami (AKAM), Amazon (AMZN), Asana (ASAN), Alteryx (AYX), Couchbase (BASE), Bigcommerce (BIGC), Bill.com (BILL), Confluent (CFLT), Salesforce (CRM), Crowdstrike (CRWD), Sprinklr (CXM), Datadog (DDOG), Digital Ocean (DOCN), Dynatrace (DT), Elastic (ETSC), Facebook (FB), FireEye (FEYE), Five9 (FIVN), JFrog (FROG), Fastly (FSLY), Alphabet (GOOG), HubSpot (HUBS), CS Disco (LAW), Lightspeed Commerce (LSPD), Weedmaps (MAPS), MongoDB (MDB), Monday.com (MNDY), Microsoft (MSFT), Cloudflare (NET) New Relic (NEWR), Nice (NICE), ServiceNow (NOW), Okta (OTKA), Olo (OLO), Palo Alto Networks (PANW), Par (PAR), Procore (PCOR), Pagerduty (PD), Anaplan (PLAN), Palantir (PLTR), RingCentral (RING), Riskified (RSKD), SentinelOne (S), Shopify (SHOP), Snowflake (SNOW), Splunk (SPLK), Squarespace (SQSP), Sumo Logic (SUMO), TaskUs (TASK), Atlassian (TEAM), Twilio (TWLO), Vtex (VTEX), Wix.com (WIX), Zoominfo (ZI), Zoom Video (ZM), Zscaler (ZS), Workday (WDAY)
Scatter Plots:
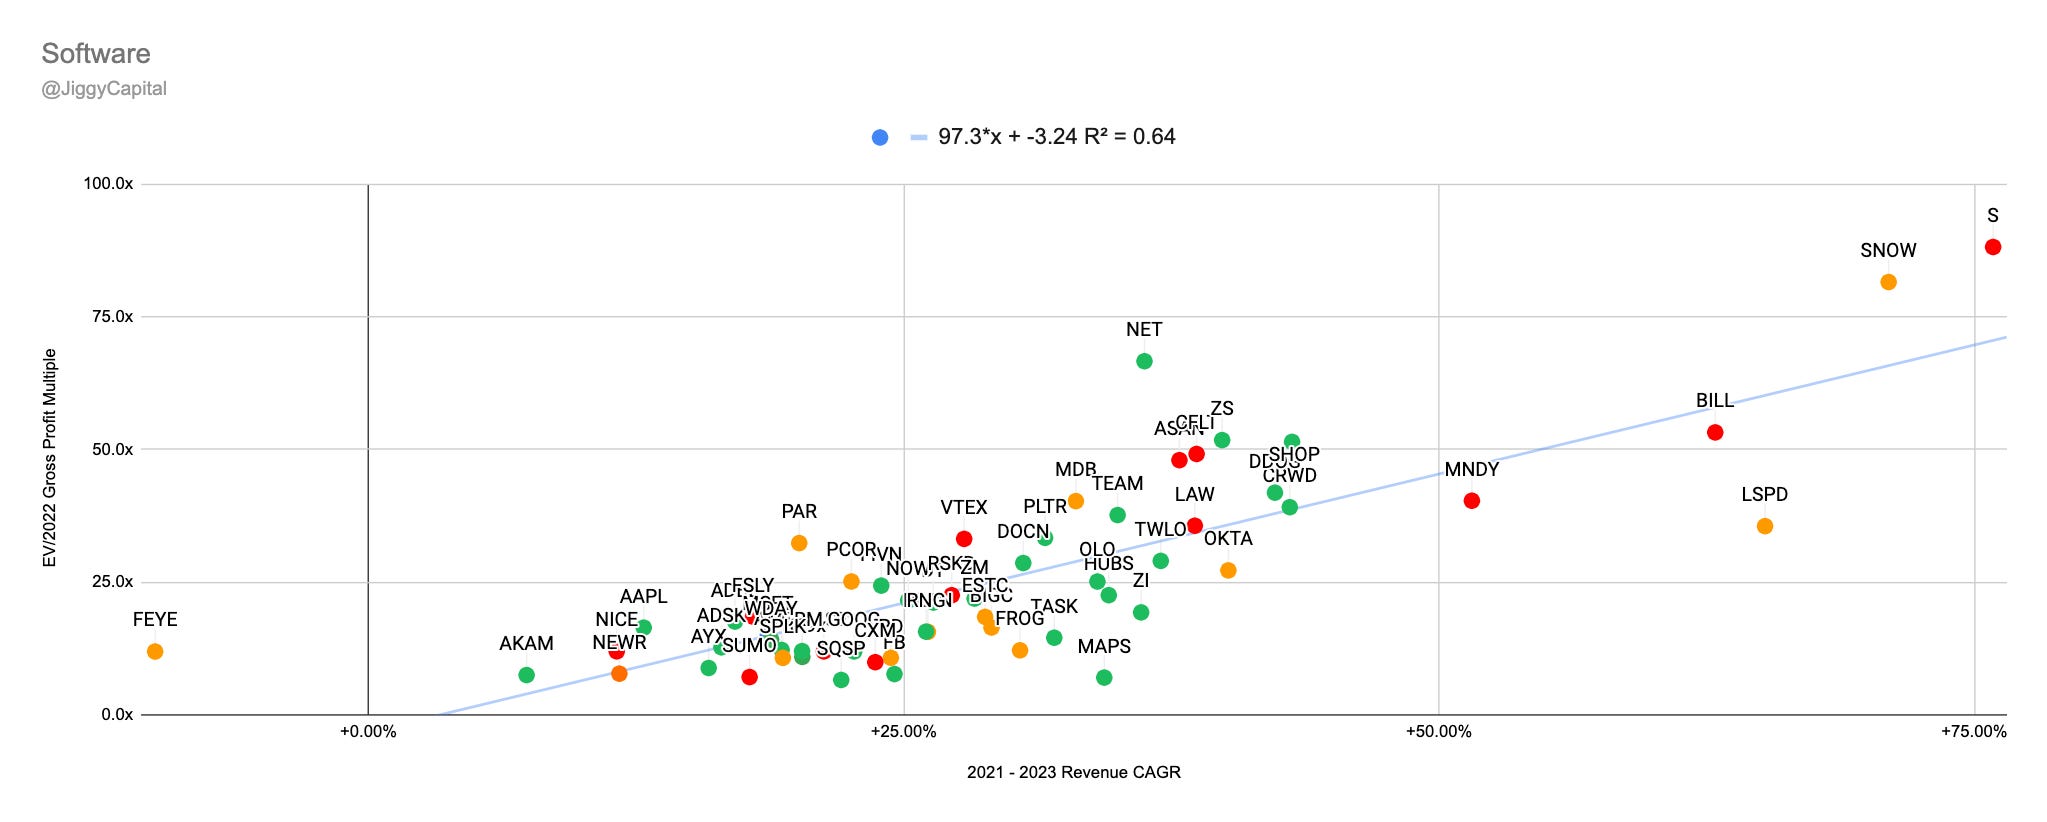
2021-2023 Revenue CAGR vs EV/2022 Gross Profit Multiple:
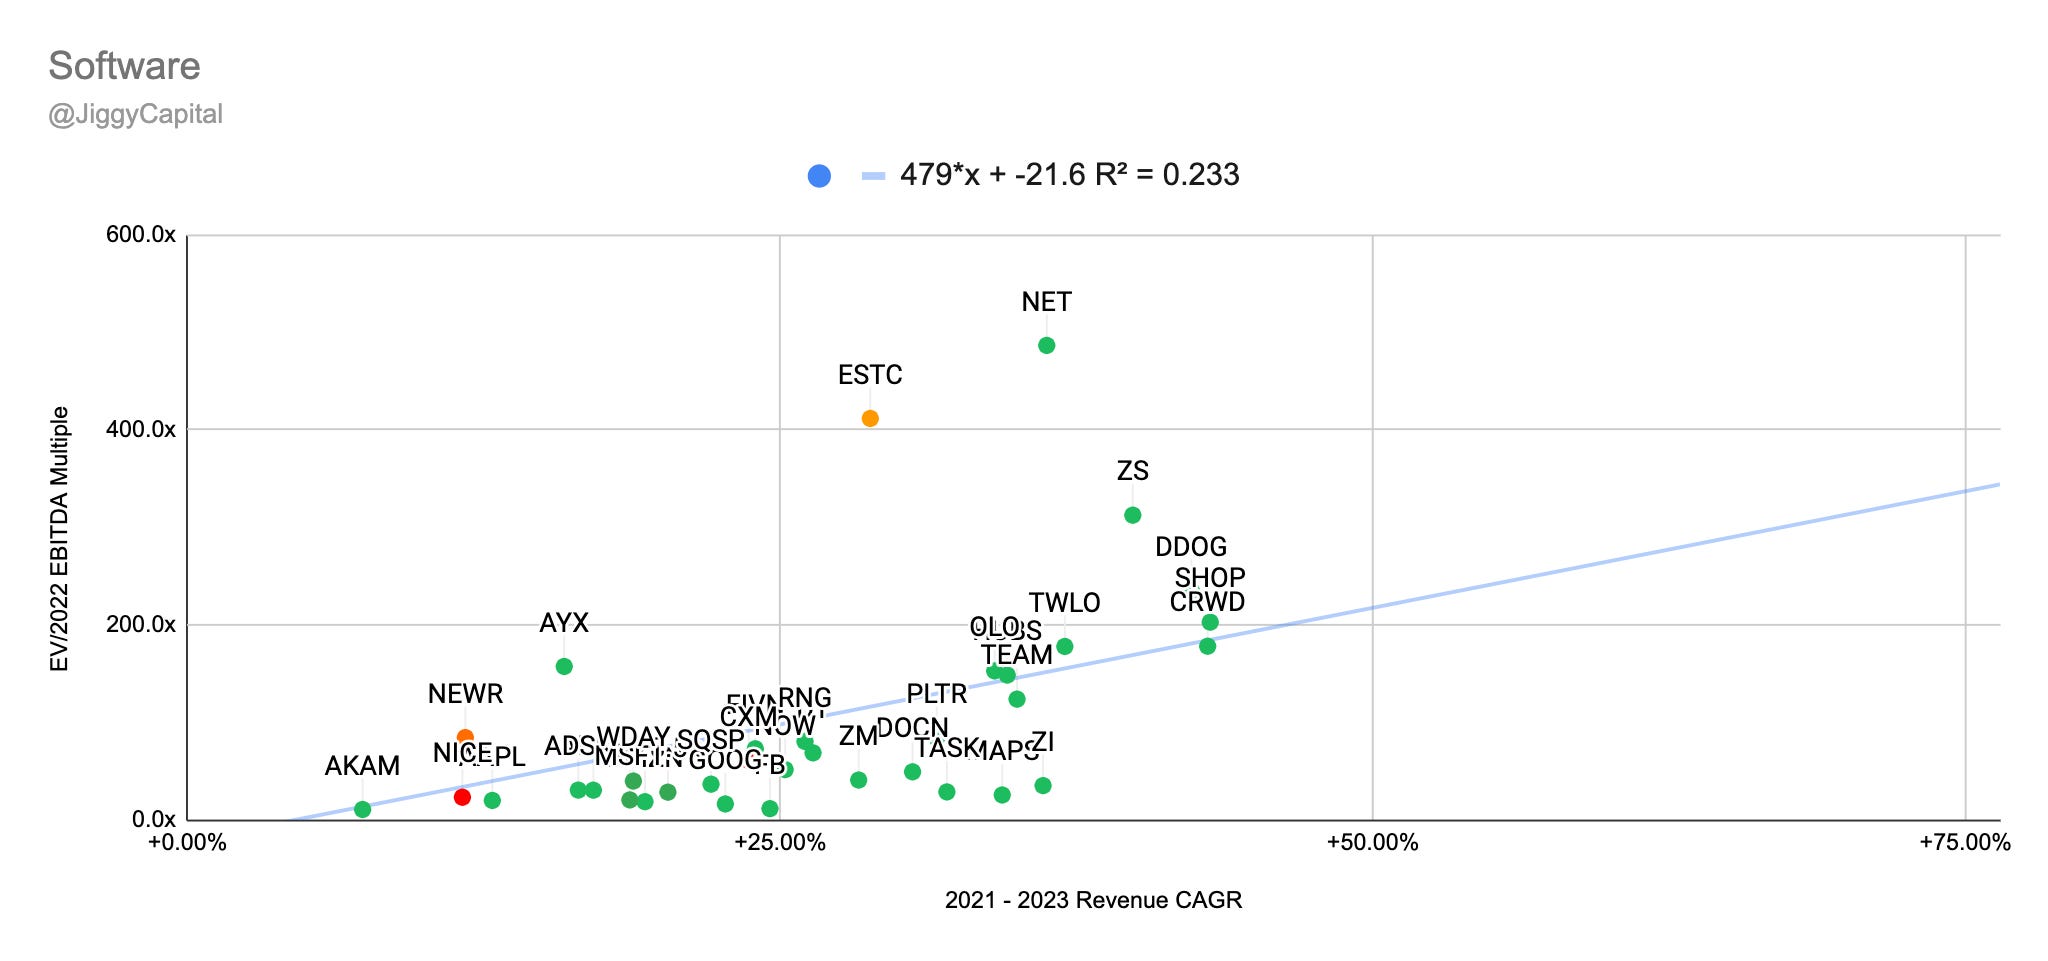
2021-2023 Revenue CAGR vs EV/2022 EBITDA Multiple:
Sector Stats:
Median Gross Margins: 73%
Median 2022e EBITDA Margin: 12%
Median 2021-2023 Projected Revenue CAGR: 25%
Median EV/2022e GP Multiple: 20.3x
Median EV/2022e EBITDA Multiple: 63.6x
Sector Highlights:
Strongest Gross Margins: Weedmaps (96%)
Strongest 2022e EBITDA Margins: Akami (45%)
Strongest 2021-2023 Projected Revenue CAGR: SentinelOne (76%)
Weakest Gross Margins: Par Technology (18%)
Weakest 2022e EBITDA Margins: SentinelOne (-53%)
Weakest 2021-2023 Projected Revenue CAGR: FireEye (-10%)
Scatter Plot Trendline Error Percentage:
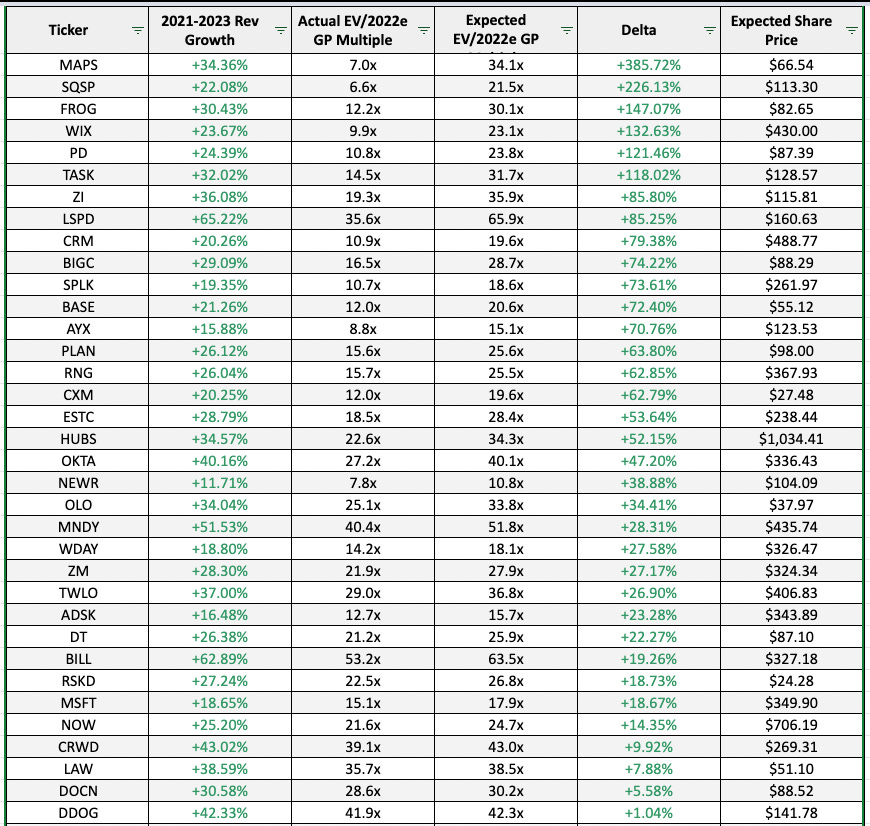
“Undervalued”:
Gross Profit: Weedmaps (+385% Upside)
EBITDA: Weedmaps (+457% Upside)
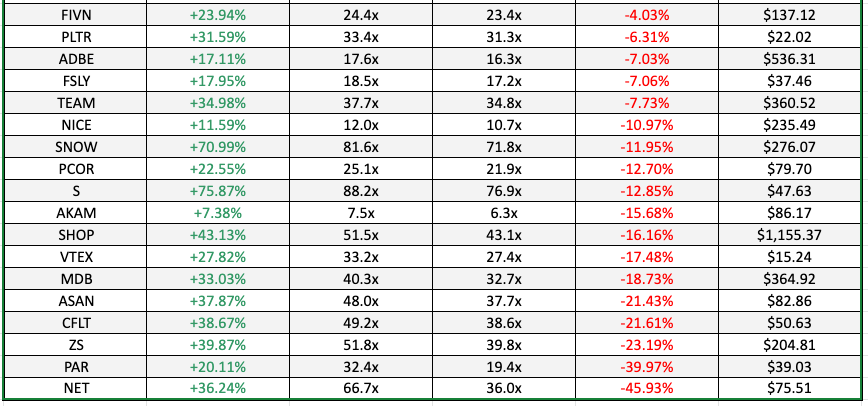
“Overvalued”:
Gross Profit: Cloudflare (-46% Downside)
EBITDA: Elastic (-72% Downside)
Full Data:
Gross Profit:
EBITDA:
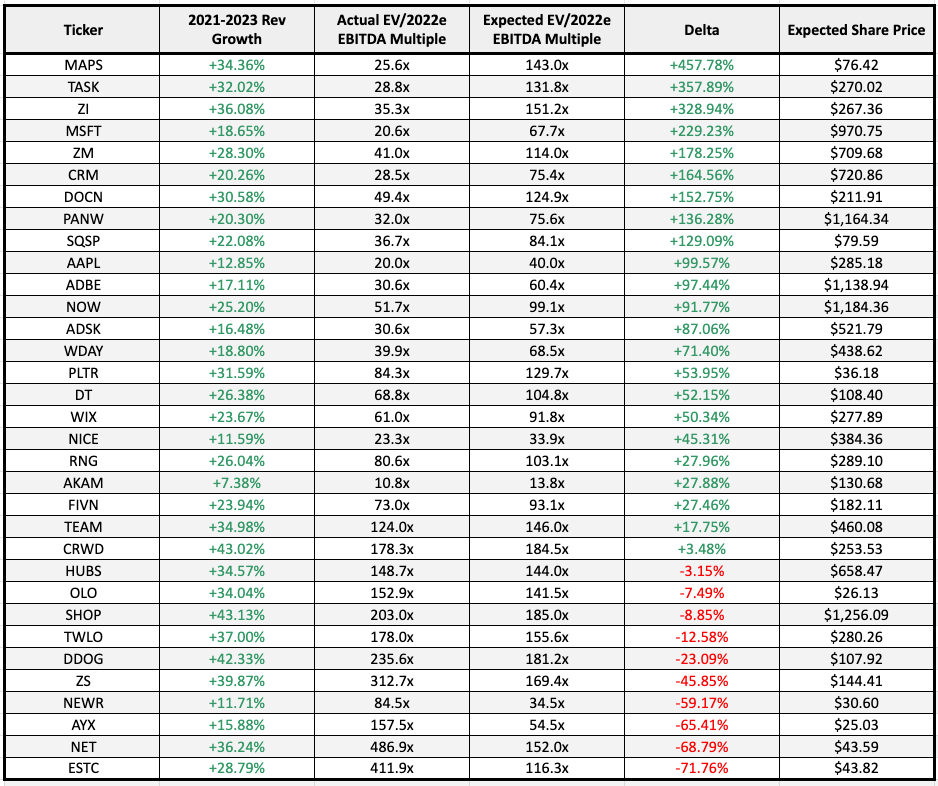
My Take
This was quite the large group and the gross profit multiple scatter plot had a semi decent R2 which I thought was interesting. Once you take it to the EBITDA level though it became much more spread out, but still some interesting takeaways. Weedmaps isn’t primarily software (more of a platform), but still has those elements in their offering so I thought it was fine to include them.
Most interesting to me was not Cloudflare being “overvalued”, but names like Shopify, Adobe, Hubspot being slightly “overvalued” on an EBITDA basis.
Conclusion
I hope this iteration of this Sector Analysis was easier to follow than the first, and that the addition of EBITDA scatter plots was an interesting second layer! I’ll quickly go through each sector with the company that stood out the most to me:
AdTech: Magnite
Big Tech: Facebook
Clean Energy: Honeywell
Cloud Infrastructure: Crowdstrike
eCommerce: Etsy
Fintech: DLocal
Food & Drink: Shake Shack
Gaming: Roblox
iGaming: Evolution
Platform: Pinterest
Real Estate: Zillow Group
Retail: Restoration Hardware
Social Media: Pinterest
Software: Digital Ocean/ZoomInfo
This newsletter made me the most intrigued with DLocal though overall, amazing bottom line margins, growing revenue 48% QoQ 186% YoY, projected 79% 2021-2023 revenue CAGR, 196% Net Revenue Retention, founder led…you don’t see that every day. Lockup is end of next month, I think there’s some opportunity to ease into a position.
Remember, this is just one piece of the puzzle for an investment decision, and I would suggest not basing an investment or trade even on valuation arbitrage as much fun as that might be. Most of these stocks are trading at a discount for one reason or another (especially if you believe in efficient markets), so please do your due diligence if a name intrigues after this newsletter!
Here is the full spreadsheet I used for this data!
- Sean
Fantaxtsic
Amazing work, thank you