

Overview
I’ve hopefully returned for good now in my very late first newsletter of Q3 2022, where I’ll to be doing my fifth edition of Sector Analysis. I’m going to expand the group from 6 sectors in the last edition to now 7 adding the (very broad) Industrials sector for fun.
The spreadsheet containing all the below data can be found here and can also be found on my Substack home page side bar.
I’ll be breaking down each sector into 5 main parts:
Charts: This will be where the EV/GP and EV/EBITDA scatter plots will be shown. I decided I’m not going to publish the full spreadsheet data this time around since it was so messy last time but I’ll be linking my spreadsheet public to view at the bottom.
2022-2024 Projected Revenue CAGR vs. Enterprise Value / 2023 Expected Gross Profit (EV/2023 GP) Scatter Plot
2022-2024 Projected Revenue CAGR vs. Enterprise Value / 2023 Expected EBITDA (EV/2023 EBITDA) Scatter Plot
For the three software sections, I’ll be using FCF instead.
2022e Rule of 40 Group Chart
Where the scatter plot dots have a color code:
Green = Company is EBITDA positive in 2022
Orange = Company is projected to be EBITDA positive by 2024
Red = Company is not projected to be EBITDA positive by 2024
Sector Stats: I’ll be highlighting the various sector’s median 2021-2023 revenue CAGR, gross margins, EV/2022e GP and EV/2022e EBITDA multiples.
Sector Highlights: I’ll be highlighting the companies with the strongest and weakest gross margins, EBITDA margins, and 2022-2024 projected revenue CAGR.
Scatter Plot Trendline Error Percentage: Using the sector scatter plot generated trendline equation, I look at the biggest discrepancies between their actual EV/2023e GP and EBITDA multiples versus their expected ones.
My Take: A quick one or two sentence take on the output data.
The forward projections are taken from Koyfin average analyst estimates, which I use multiple times a day and think it’s the best service out there for any fundamental company analysis. I also use their Enterprise Value data, and the rest comes from google finance function on google sheets. This stuff really isn’t that hard to create for anyone thinking about it, but it’s more maintenance than anything.
The sectors I will be looking at in the newsletter are:
Application Software
Financial Services
Industrials
Infrastructure Software
Internet
Semiconductor
Software
Before we get started, I want to go over key assumptions:
I’m assuming the financial information gathered is correct - Please let me know if something is off for a company I’d be happy to look into it further and correct it.
I’m assuming with forward gross profit projections that their gross profit margin won’t change — This obviously isn’t reality as margins expand/contract over time as a companies’ business changes/scales but this is the best I can do (as of now at least).
Gross profit margin is also a metric that can be left for some company interpretation where you can hide some costs elsewhere down the line items.
Also worth noting, this kind of analysis is not looking at the quality of a company, management team, market position, optionality, runway, and even more importantly the quality of revenue profile (recurring vs transaction-based vs unrelated one-time revenues).
To state the obvious — this is only one piece of the puzzle and shouldn’t be used as financial advice and taken with a grain of salt :)
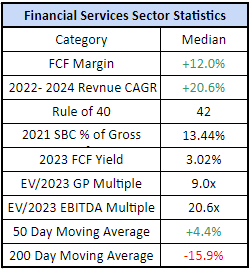
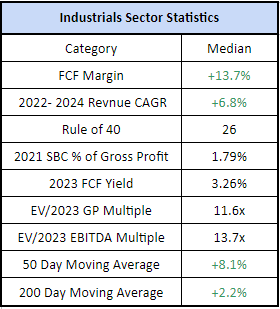
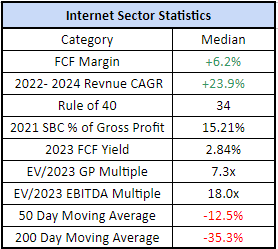
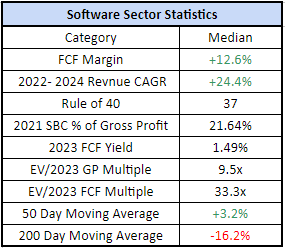
Now let’s get into it with overall sector statistics across the various categories shown below:
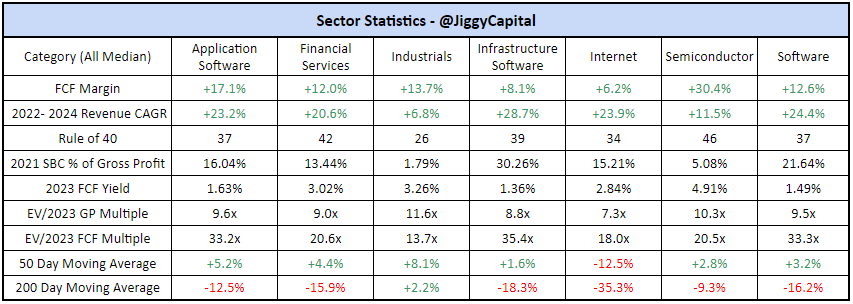
To sum up the leaders in each category:
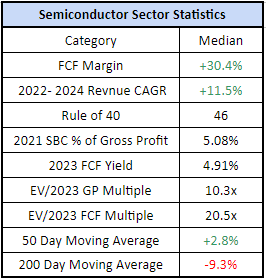
FCF Margin: Semiconductors — 30.4%
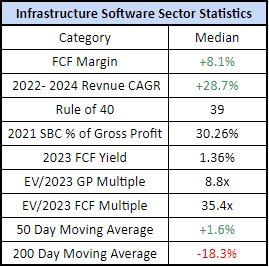
2022-2024 Revenue CAGR: Infrastructure Software — 28.7%
Rule of 40: Semiconductors — 46
2021 SBC as % Gross Profit: Industrials — 1.8%
2023 FCF Yield %: Semiconductors — 5.1%
EV/2023 GP Multiple: Internet — 7.3x
EV/2023 FCF Multiple: Internet — 18.0x
% Above 50 Day Moving Average: Industrials — +8.1%
% Above 200 Day Moving Average: Industrials — +2.2%
Sector Analysis
Application Software
Group (45): Adobe ADBE 0.00%↑, Autodesk ADSK 0.00%↑, Amplitude AMPL 0.00%↑, Asana ASAN 0.00%↑, BigCommerce BIGC 0.00%↑, Bill.com BILL 0.00%↑, Blackline BL 0.00%↑, Braze BRZE 0.00%↑, Ceridian CDAY 0.00%↑, Coupa COUP 0.00%↑, Salesforce CRM 0.00%↑, Sprinklr CXM 0.00%↑, Docusign DOCU 0.00%↑, Expensify EXFY 0.00%↑, Five9 FIVN 0.00%↑, Freshworks FRSH 0.00%↑, Alphabet GOOG 0.00%↑, HubSpot HUBS 0.00%↑, Intuit INTU 0.00%↑, Lightspeed LSPD 0.00%↑, Monday.com MNDY 0.00%↑, Microsoft MSFT 0.00%↑, Nice NICE 0.00%↑, ServiceNow NOW 0.00%↑, Olo OLO 0.00%↑, Oracle ORCL 0.00%↑, Paycom PAYC 0.00%↑, Procore PCOR 0.00%↑, Paylocity PCTY 0.00%↑, Powerschool PWSC 0.00%↑, RingCentral RNG 0.00%↑, Semrush SEMR 0.00%↑, Shopify SHOP 0.00%↑, Smartsheet SMAR 0.00%↑, Sprout Social SPT 0.00%↑, Squarespace SQSP 0.00%↑, Atlassian TEAM 0.00%↑, Toast TOST 0.00%↑, Tyler TYL 0.00%↑, Veeva VEEV 0.00%↑, Workday WDAY 0.00%↑, Zoom ZM 0.00%↑
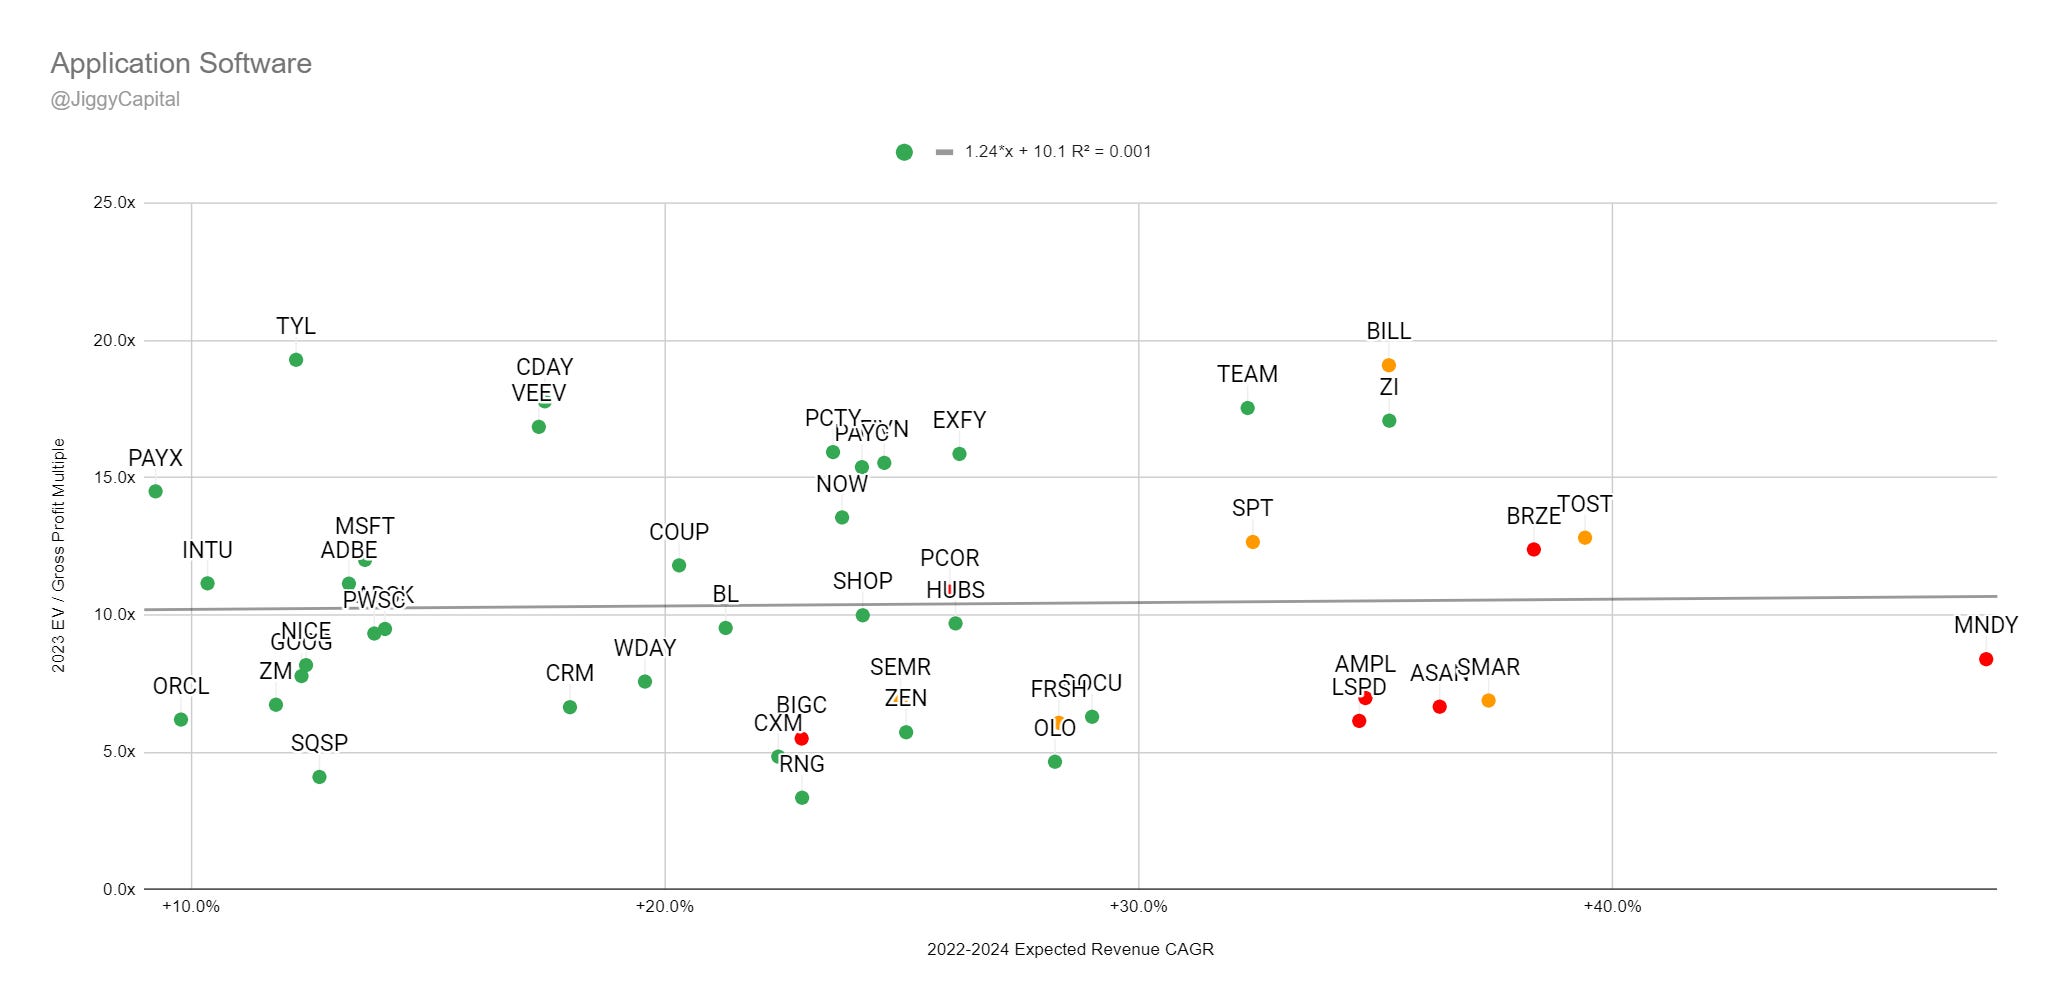
2022-2024 Revenue CAGR vs EV/2023 Gross Profit Multiple:
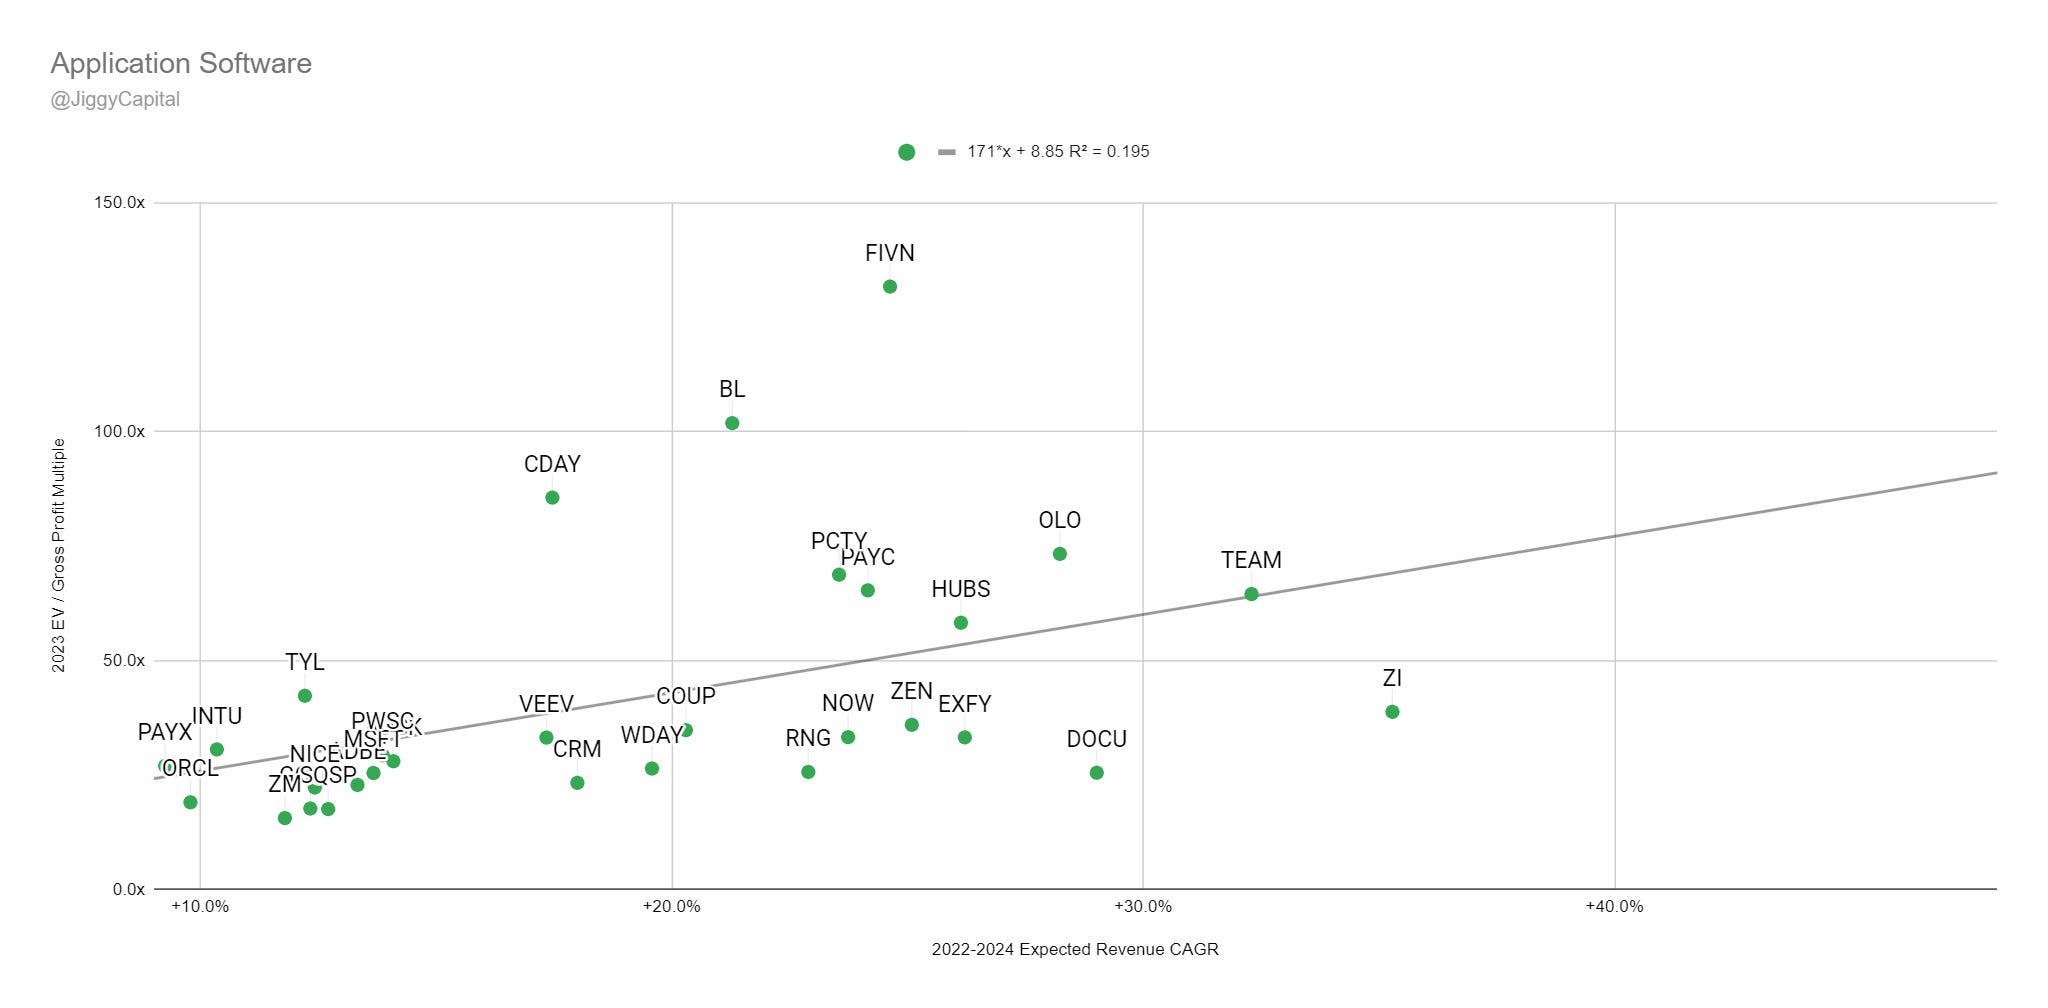
2022-2024 Revenue CAGR vs EV/2023 FCF Multiple:
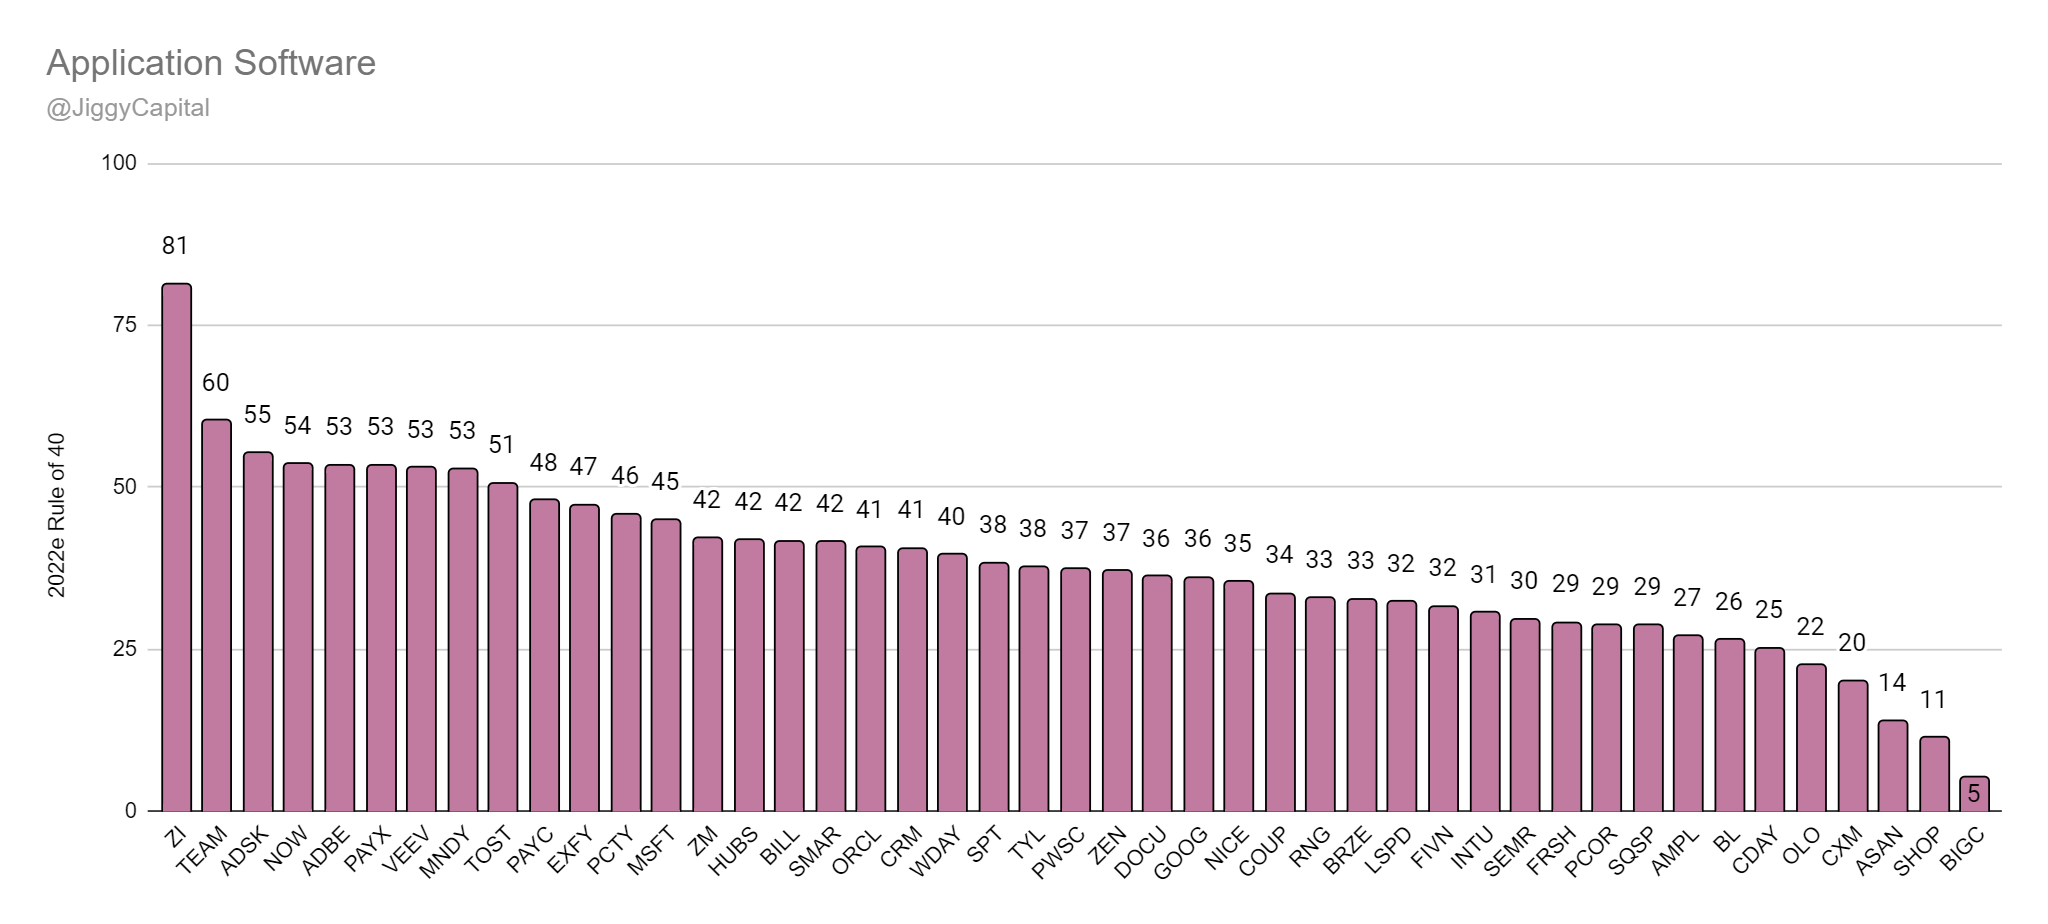
2022e Rule of 40 Scores:
Sector Stats:
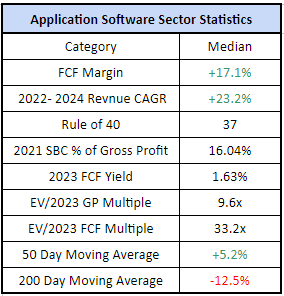
Sector Highlights:
Best Gross Margins: Autodesk — 92%
Best 2022e FCF Margins: Paychex — 43%
Best 2022-2024 Projected Revenue CAGR: Monday.com — 48%
Best 2022e Rule of 40 Score: ZoomInfo — 81
Best 2022e FCF Yield %: Zoom — 5.8%
Best 2021 SBC as % Gross Profits: Semrush — 2%
Worst Gross Margins: Ceridian — 42%
Worst 2022e FCF Margins: Asana — -30%
Worst 2022-2024 Projected Revenue CAGR: Oracle — 9%
Worst 2022e Rule of 40 Score: BigCommerce — 5
Worst 2022e FCF Yield %: BigCommerce — -4.61%
Worst 2021 SBC as % Gross Profits: Freshworks — 59%
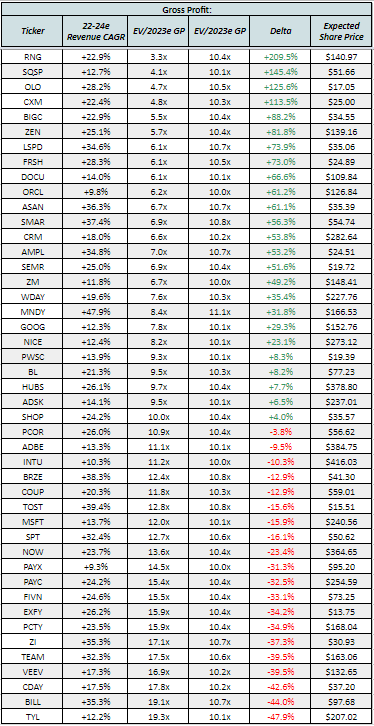
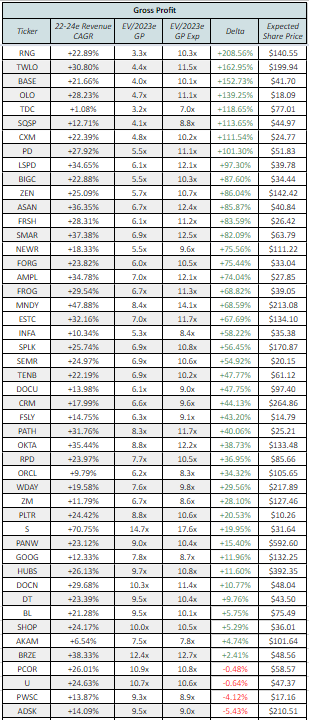
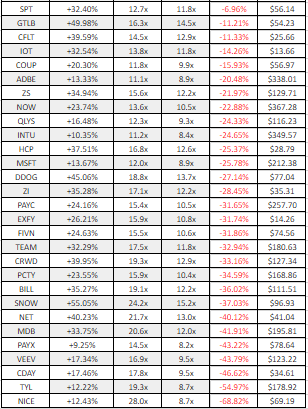
Scatter Plot Trend Line Error Percentage:
“Undervalued”:
Gross Profit: RingCentral (+209% Upside)
EBITDA: RingCentral (+94% Upside)
“Overvalued”:
Gross Profit: Tyler Technologies (-48% Downside)
EBITDA: Five9 (-59% Downside)
Full Data:
Gross Profit:
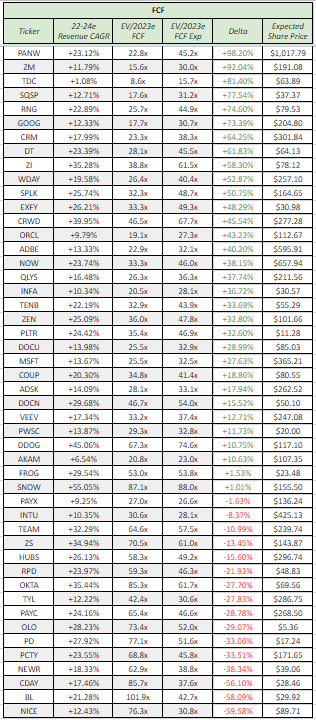
FCF:
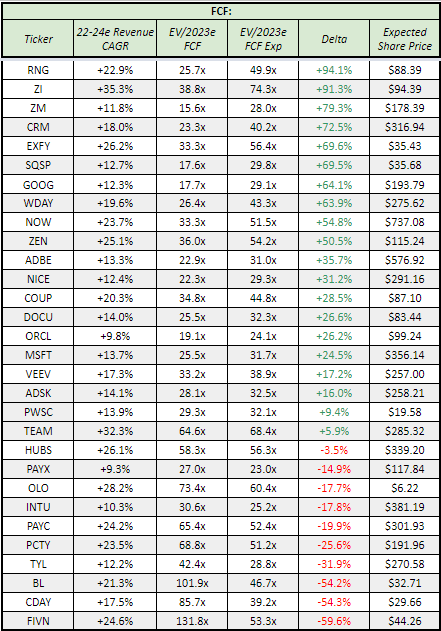
My Take: What is crazy to me is I wouldn’t even call RingCentral that hated to have their multiple compress so much to the level it’s gotten to this year. UCaaS in general has not been shown anything close to investor love for the better part of the last two years, but RNG is by all means still a decent to good company that makes money.
I find it pretty amusing that Bill.com and Tyler Technologies are duking it out for the highest EV/GP multiples of the group (yes there is context needed haha).
Financial Services
Group (27): Adyen $ADYEY, Affirm AFRM 0.00%↑, American Express AXP 0.00%↑, Bill.com BILL 0.00%↑, Blend Labs BLND 0.00%↑, Cboe CBOE 0.00%↑, Coinbase COIN 0.00%↑, dLocal DLO 0.00%↑, Fair Isaac FICO 0.00%↑, Shift4 Payments FOUR 0.00%↑, Global-E GLBE 0.00%↑, Robinhood HOOD 0.00%↑, Intercontinental Exchange ICE 0.00%↑, Lightspeed LSPD 0.00%↑, Mastercard MA 0.00%↑, Marqeta MQ 0.00%↑, Msci MSCI 0.00%↑, Nu NU 0.00%↑, Nuvei NVEI 0.00%↑, Paypal PYPL 0.00%↑, SoFi SOFI 0.00%↑, S&P Global SPGI 0.00%↑, Block SQ 0.00%↑, Toast TOST 0.00%↑, Upstart UPST 0.00%↑, Visa V 0.00%↑
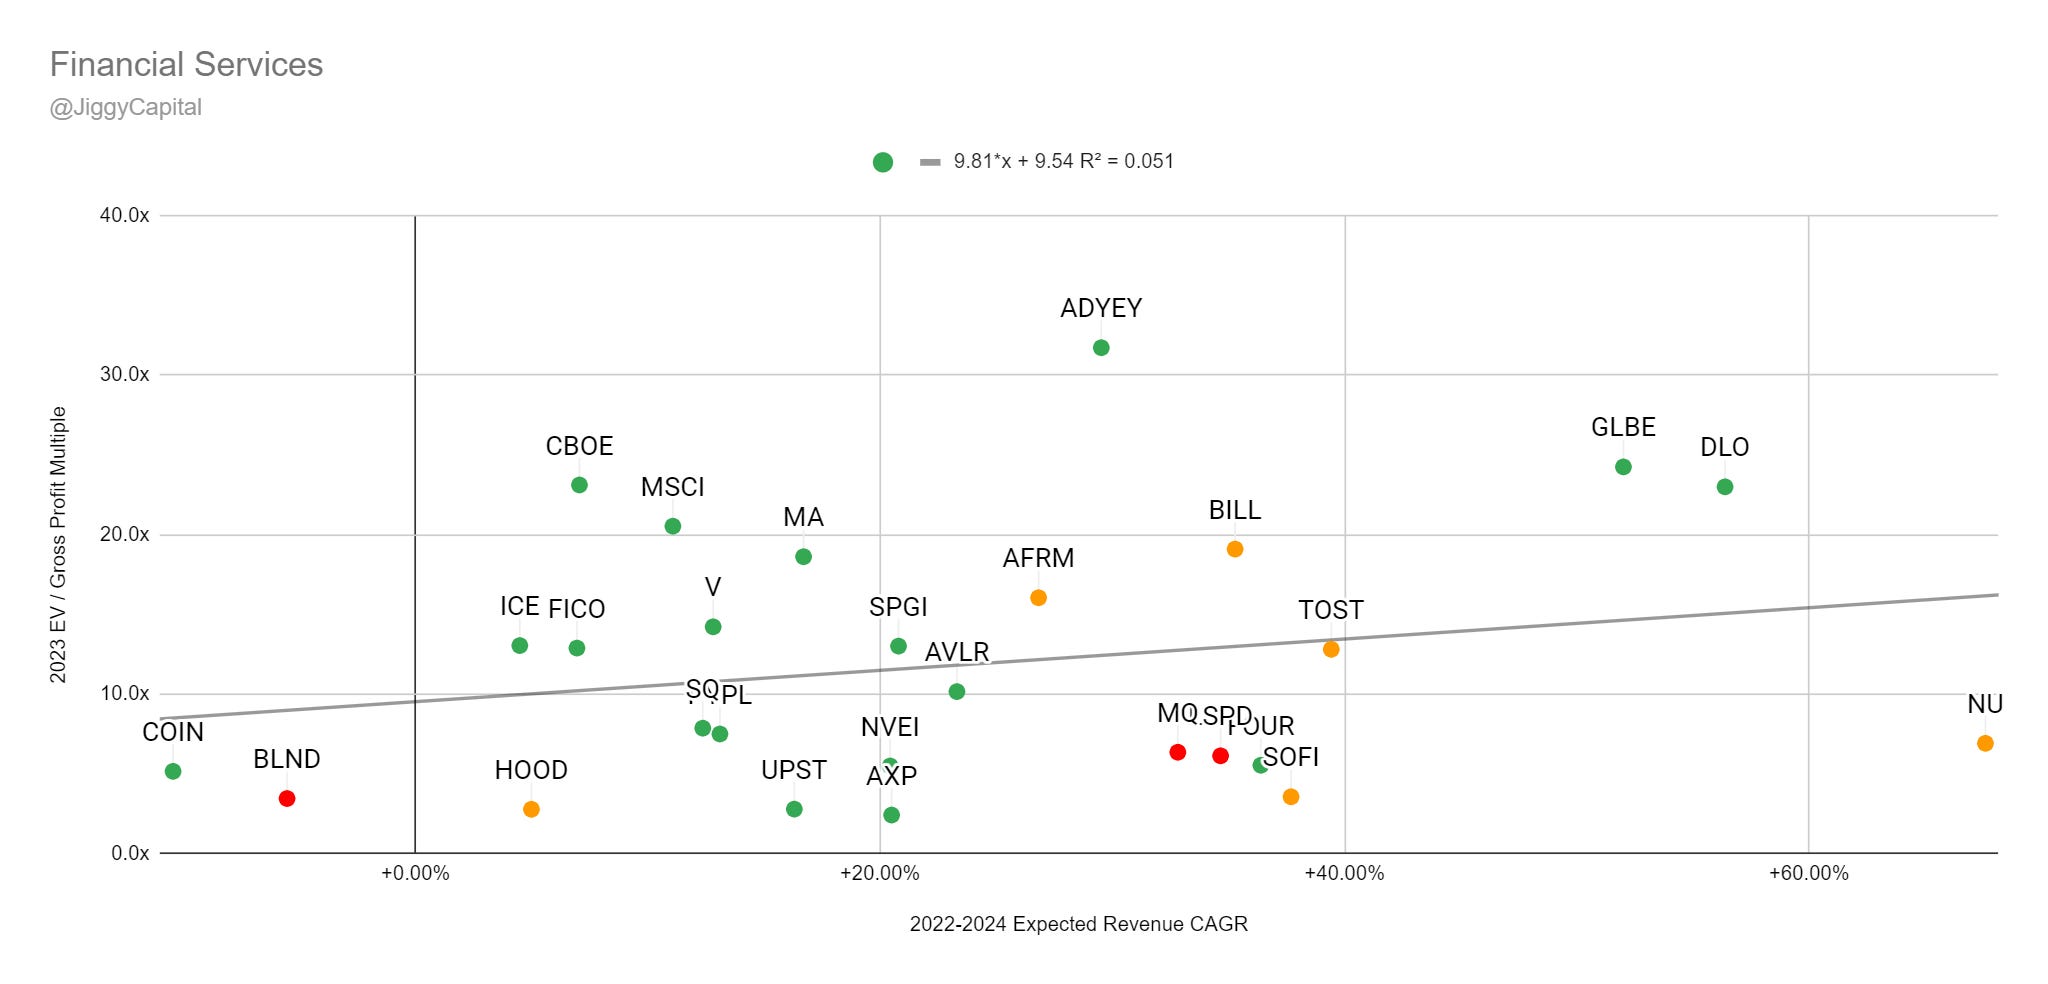
2022-2024 Revenue CAGR vs EV/2023 Gross Profit Multiple:
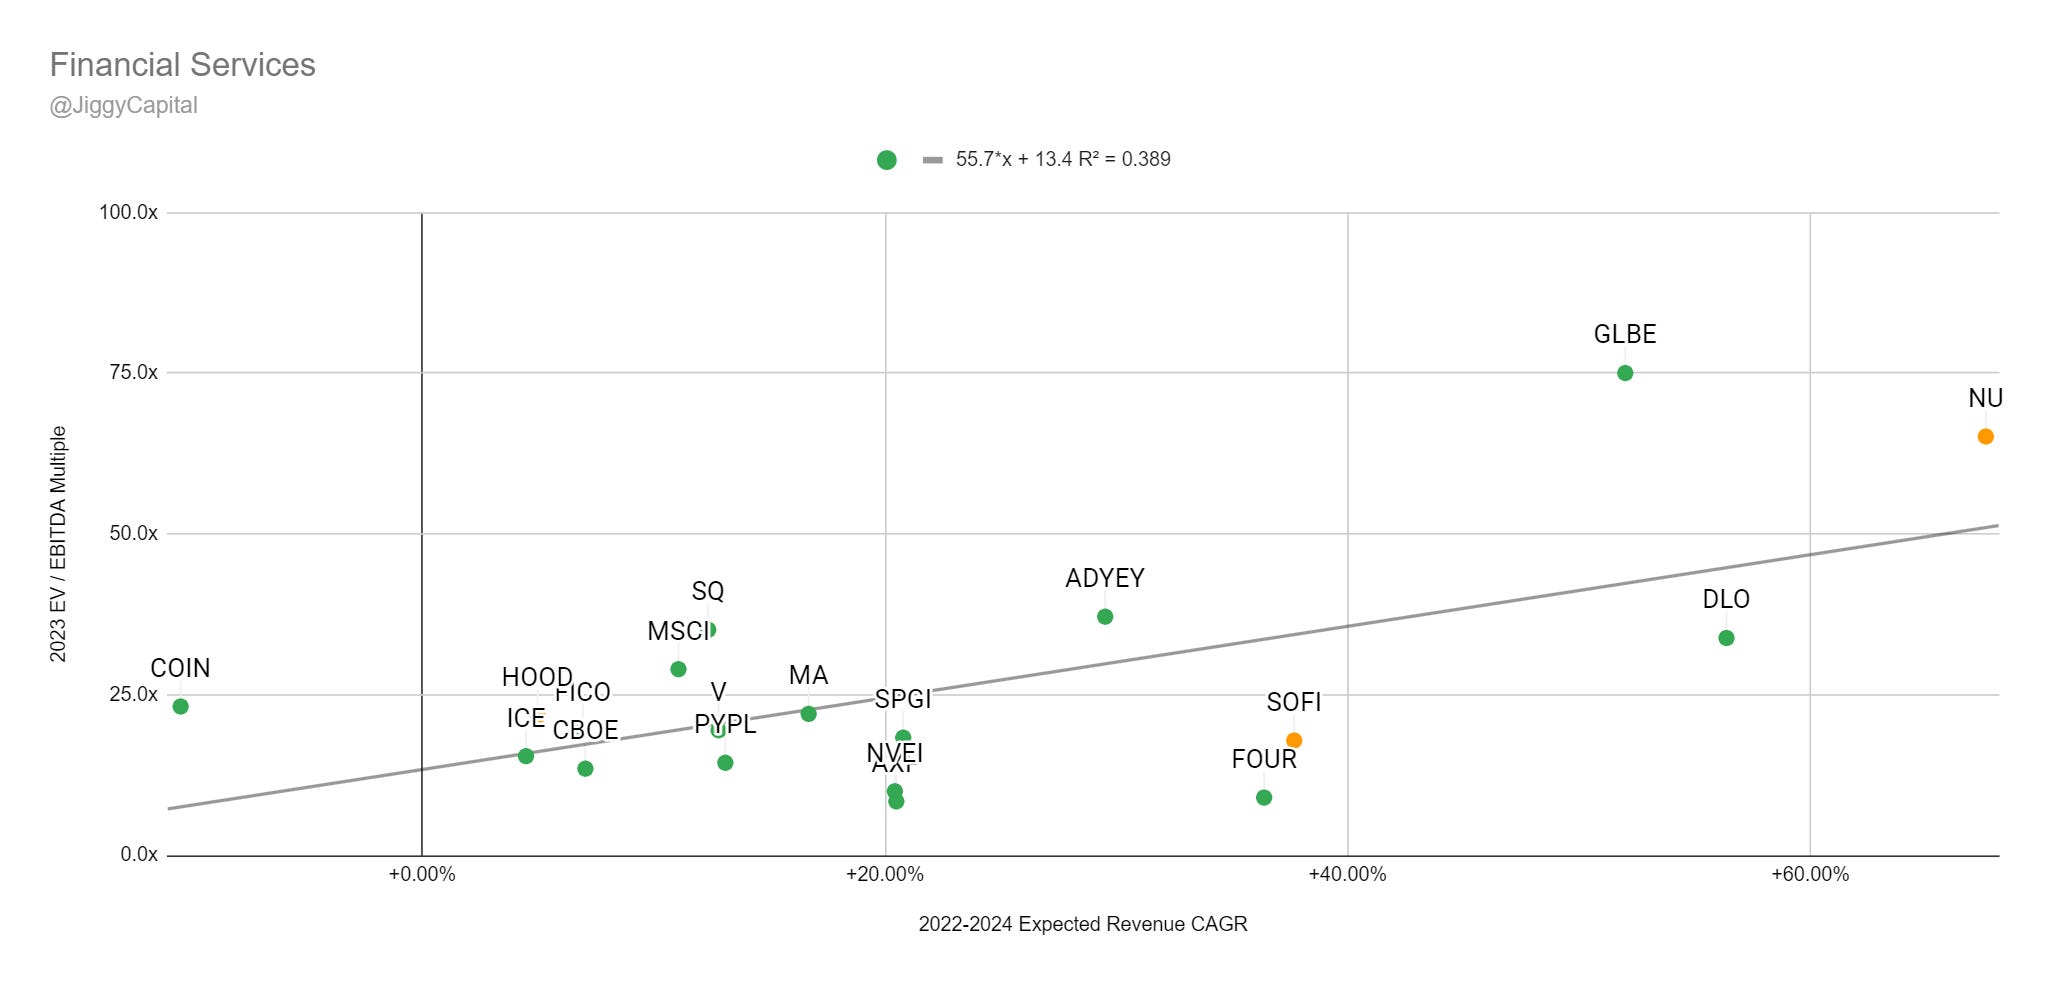
2022-2024 Revenue CAGR vs EV/2023 EBITDA Multiple:
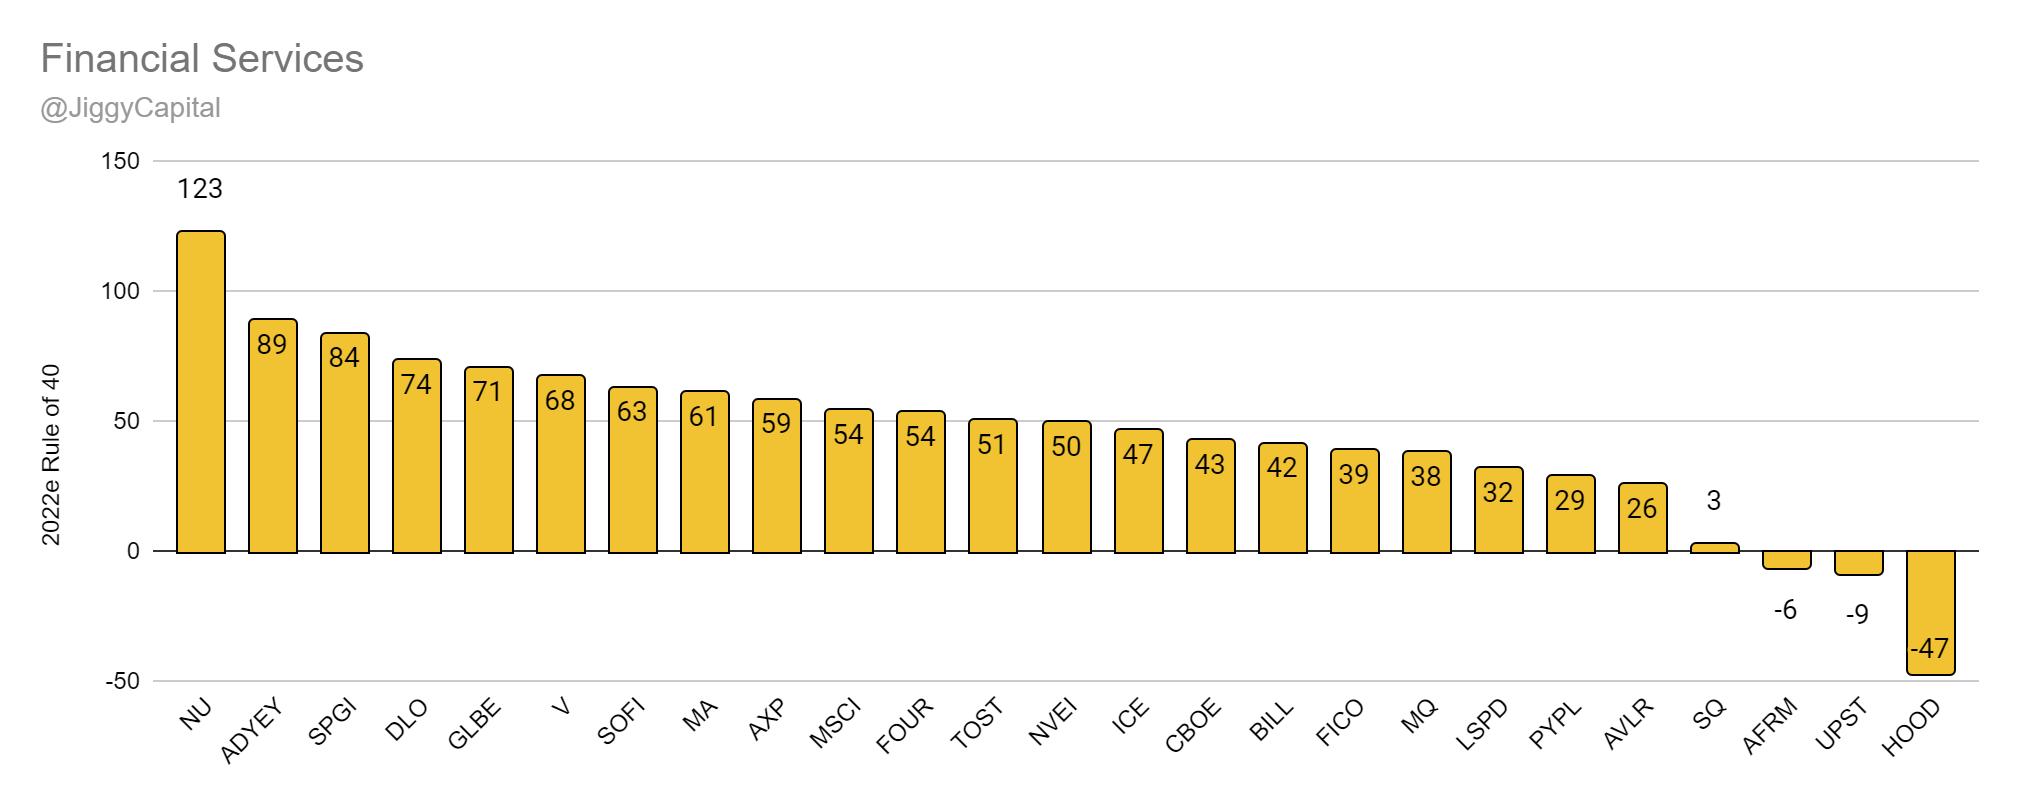
2022e Rule of 40 Scores:
Sector Stats:
Sector Highlights:
Best Gross Margins: Visa — 97%
Best 2022e EBITDA Margins: Visa — 70%
Best 2022-2024 Projected Revenue CAGR: Nu — 67%
Best 2022e Rule of 40 Score: Nu — 123
Best 2022e FCF Yield %: Nuvei - 6.3%
Best 2021 SBC as % Gross Profits: Adyen & American Express — 1%
Worst Gross Margins: Toast — 19%
Worst 2022e EBITDA Margins: Blend Labs — -55%
Worst 2022-2024 Projected Revenue CAGR: Coinbase — -10%
Worst 2022e Rule of 40 Score: Robinhood — -47
Worst 2022e FCF Yield %: Coinbase — -31.4%
Worst 2021 SBC as % Gross Profits: Robinhood — 122%
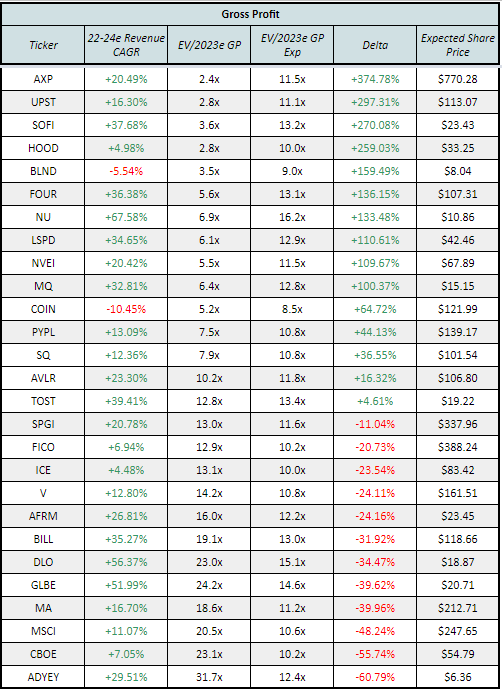
Scatter Plot Trend Line Error Percentage:
“Undervalued”:
Gross Profit: American Express (375% Upside)
EBITDA: Shift4 (273% Upside)
“Overvalued”:
Gross Profit: Adyen (-60% Downside)
EBITDA: Coinbase (-67% Downside)
Full Data:
Gross Profit:
EBITDA:
My Take: I’ve kind have turned this into a hodgepodge group evolving from just Fintech companies to now really anything related to financials with stuff like MSCI, CBOE, SPGI, etc etc.
It’s pretty incredible how much this groups multiple has compressed since I did my first Sector Analysis over a year ago, and a micro story within that’s somewhat amusing to me is that Global-E’s EBITDA multiple has held relatively well compared to it’s frequently grouped counterpart dLocal, which now has a pretty reasonable EBITDA multiple these days.
Industrials
Group (31): Advanced Auto Parts AAP 0.00%↑, American Tower AMT 0.00%↑, AutoZone AZO 0.00%↑, Caterpillar CAT 0.00%↑, Crown Castle CCI 0.00%↑, Cummins CMI 0.00%↑, Canadian National Railway CNI 0.00%↑, Canadian Pacific Railway CP 0.00%↑, Copart CPRT 0.00%↑, Carlisle Group CSL 0.00%↑, CSX Corp CSX 0.00%↑, Deere & Co DE 0.00%↑, Danaher DHR 0.00%↑, Enphase Energy ENPH 0.00%↑, FedEx FDX 0.00%↑, Fluence Energy FLNC 0.00%↑, First Solar FSLR 0.00%↑, Generac GNRC 0.00%↑, Honeywell HON 0.00%↑, Magna MGA 0.00%↑, 3M MMM 0.00%↑, Norfolk Southern NSC 0.00%↑, O’Reilly ORLY 0.00%↑, Parker-Hannifin PH 0.00%↑, Raytheon RTX 0.00%↑, Stem STEM 0.00%↑, TransDigm TDG 0.00%↑, Thermo Fischer TMO 0.00%↑, Tesla TSLA 0.00%↑, Union Pacific UNP 0.00%↑, United Parcel Service UPS 0.00%↑
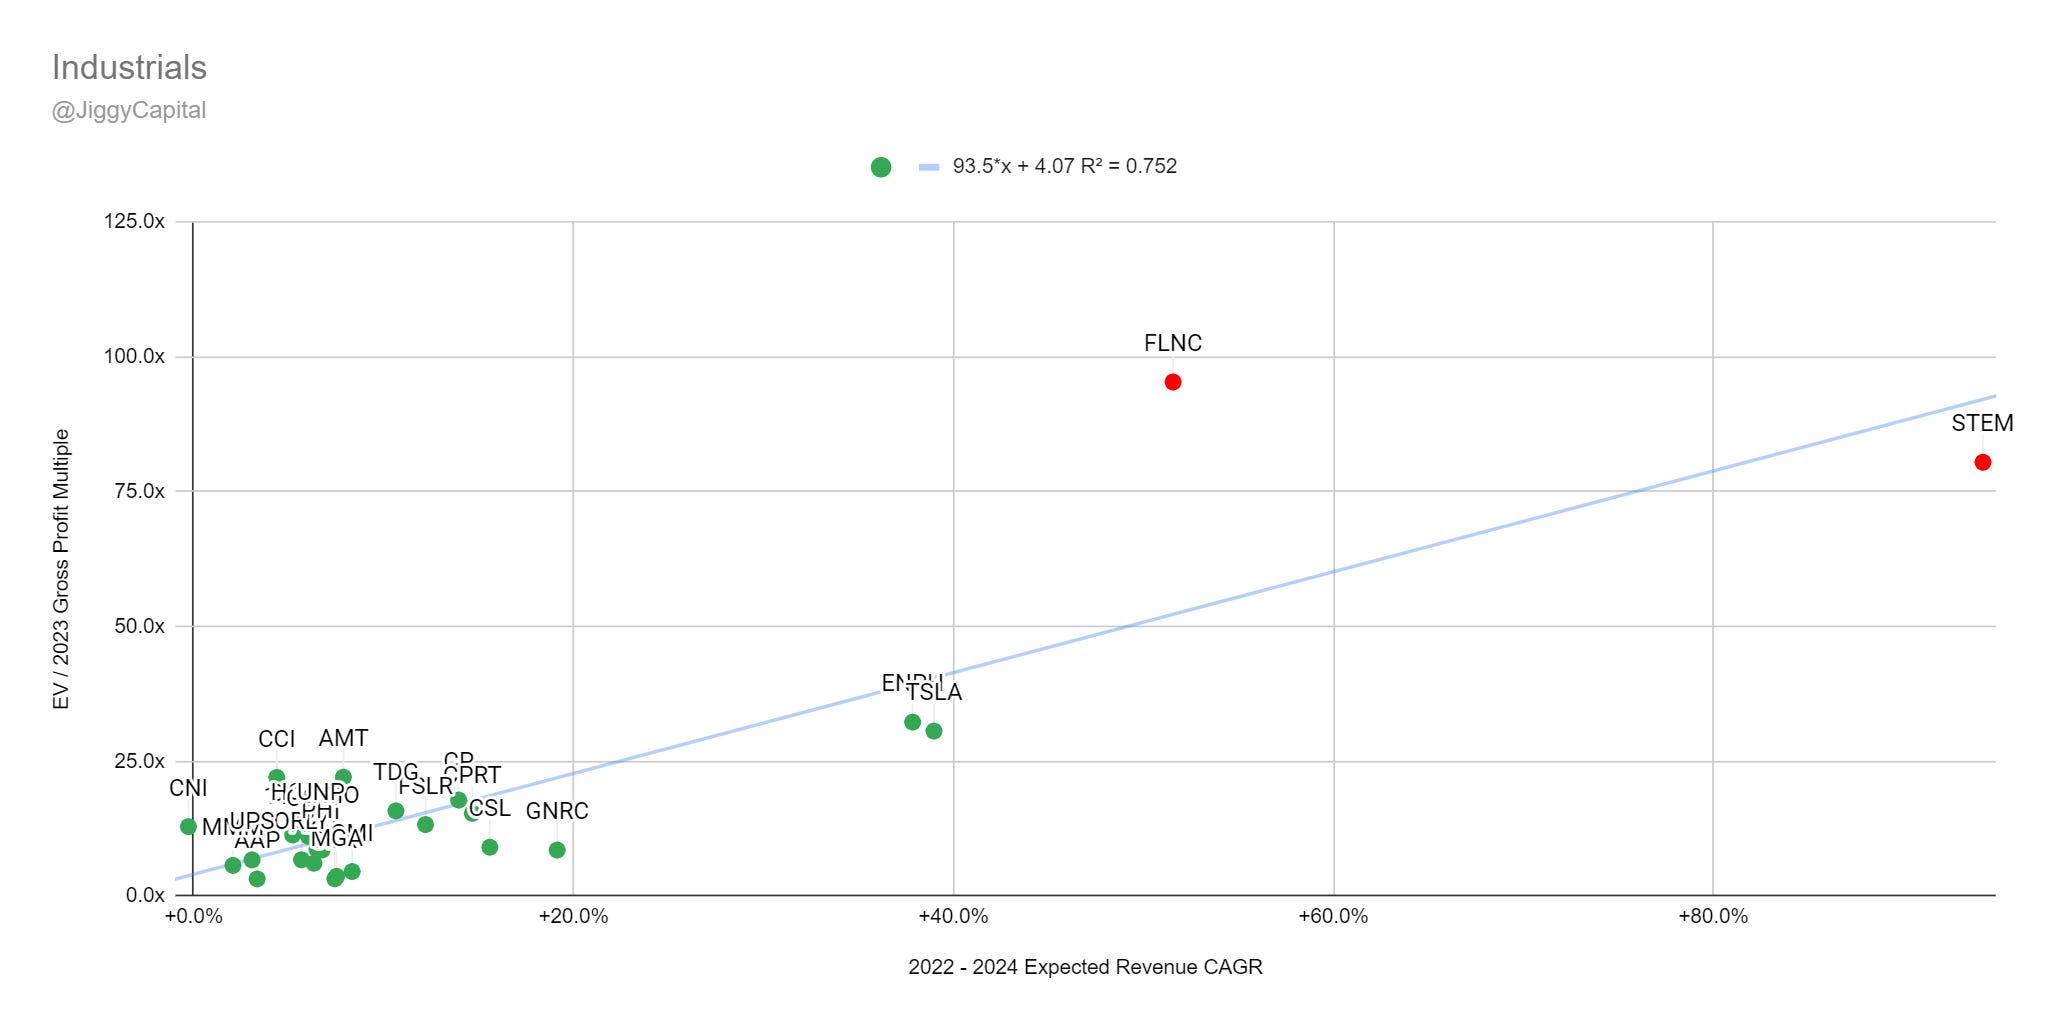
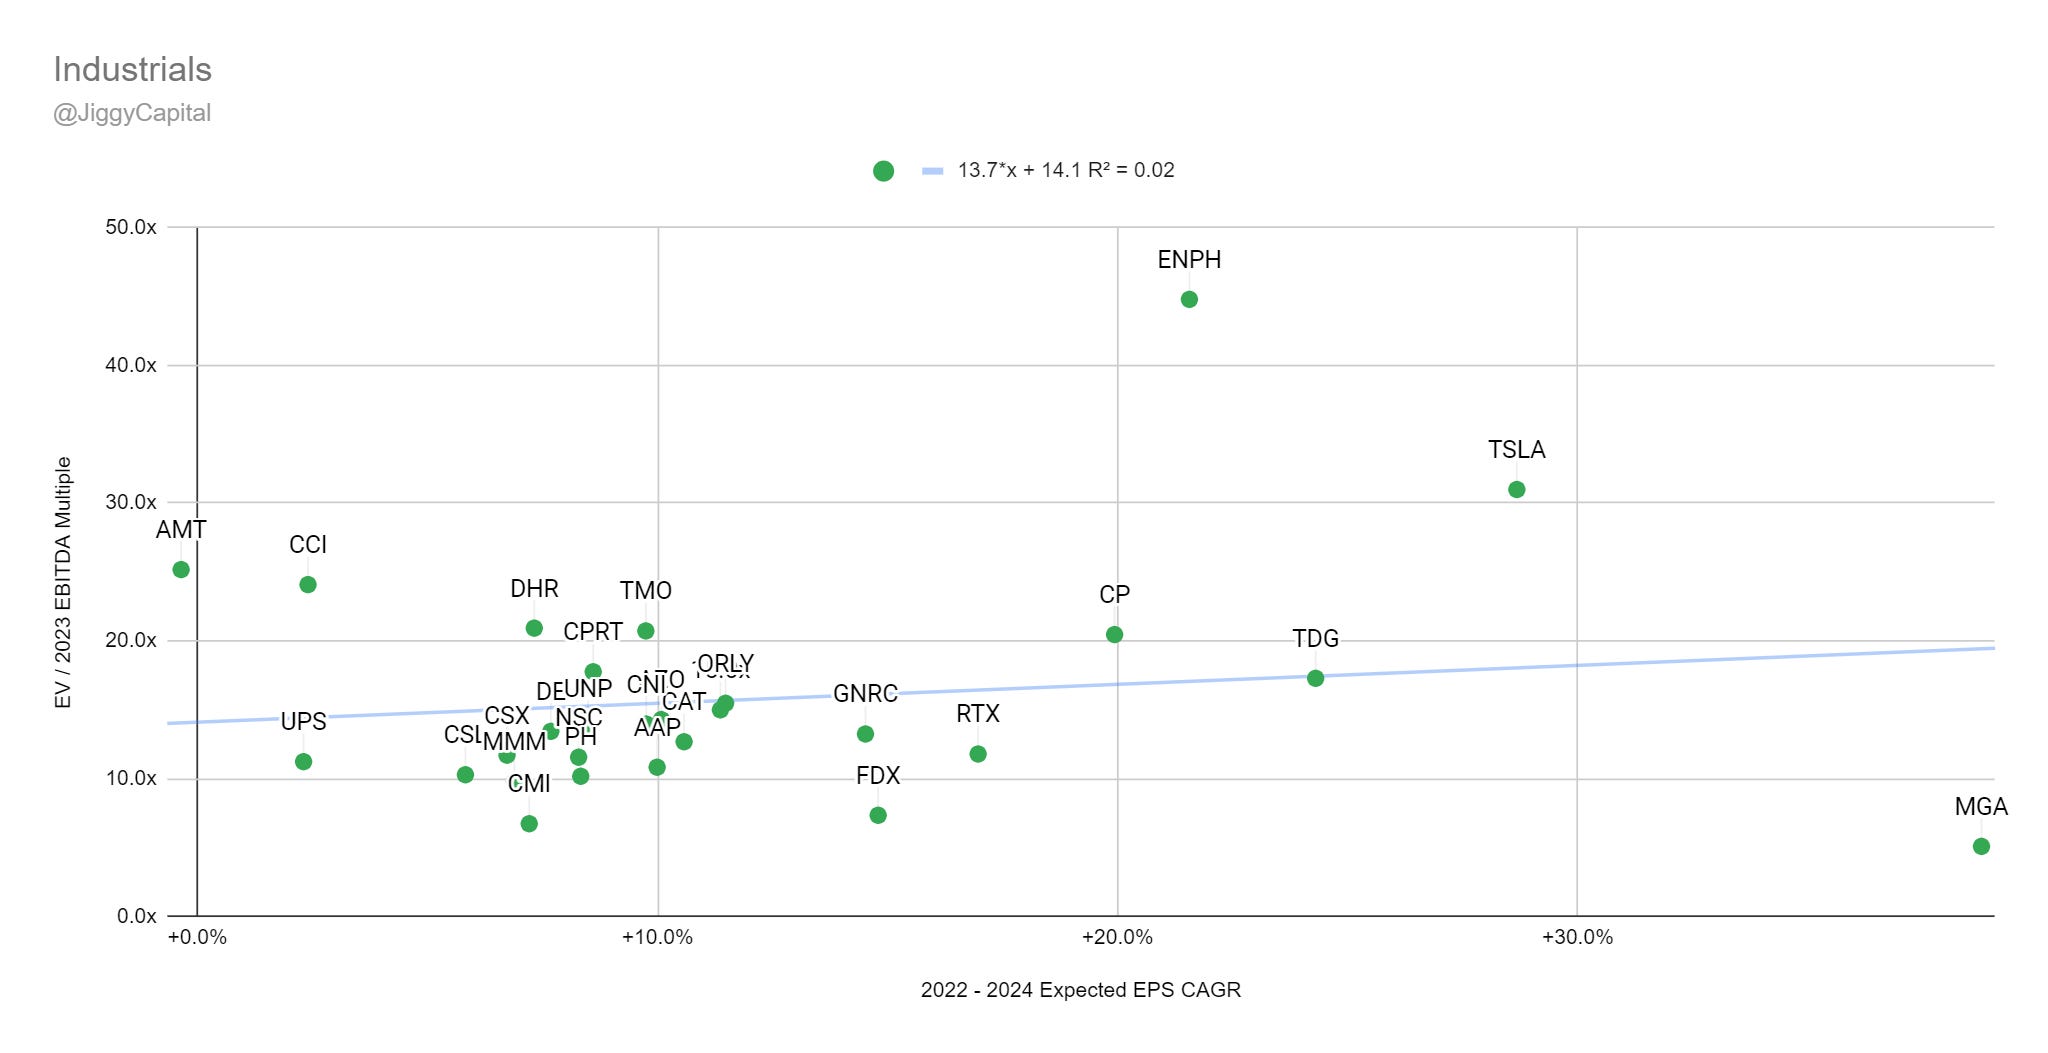
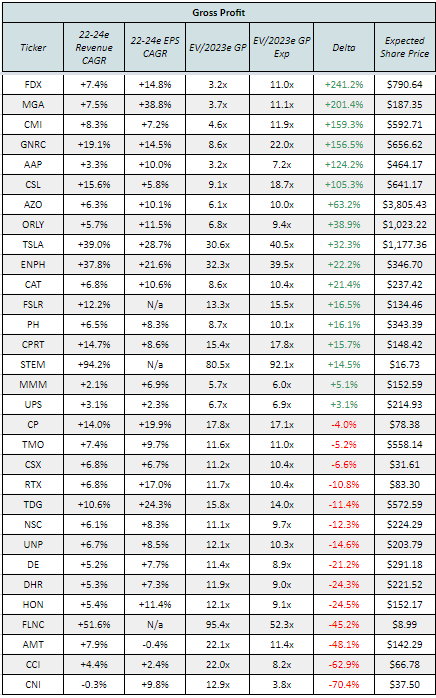
2022-2024 Revenue CAGR vs EV/2023 Gross Profit Multiple:
2022-2024 Revenue CAGR vs EV/2023 FCF Multiple:
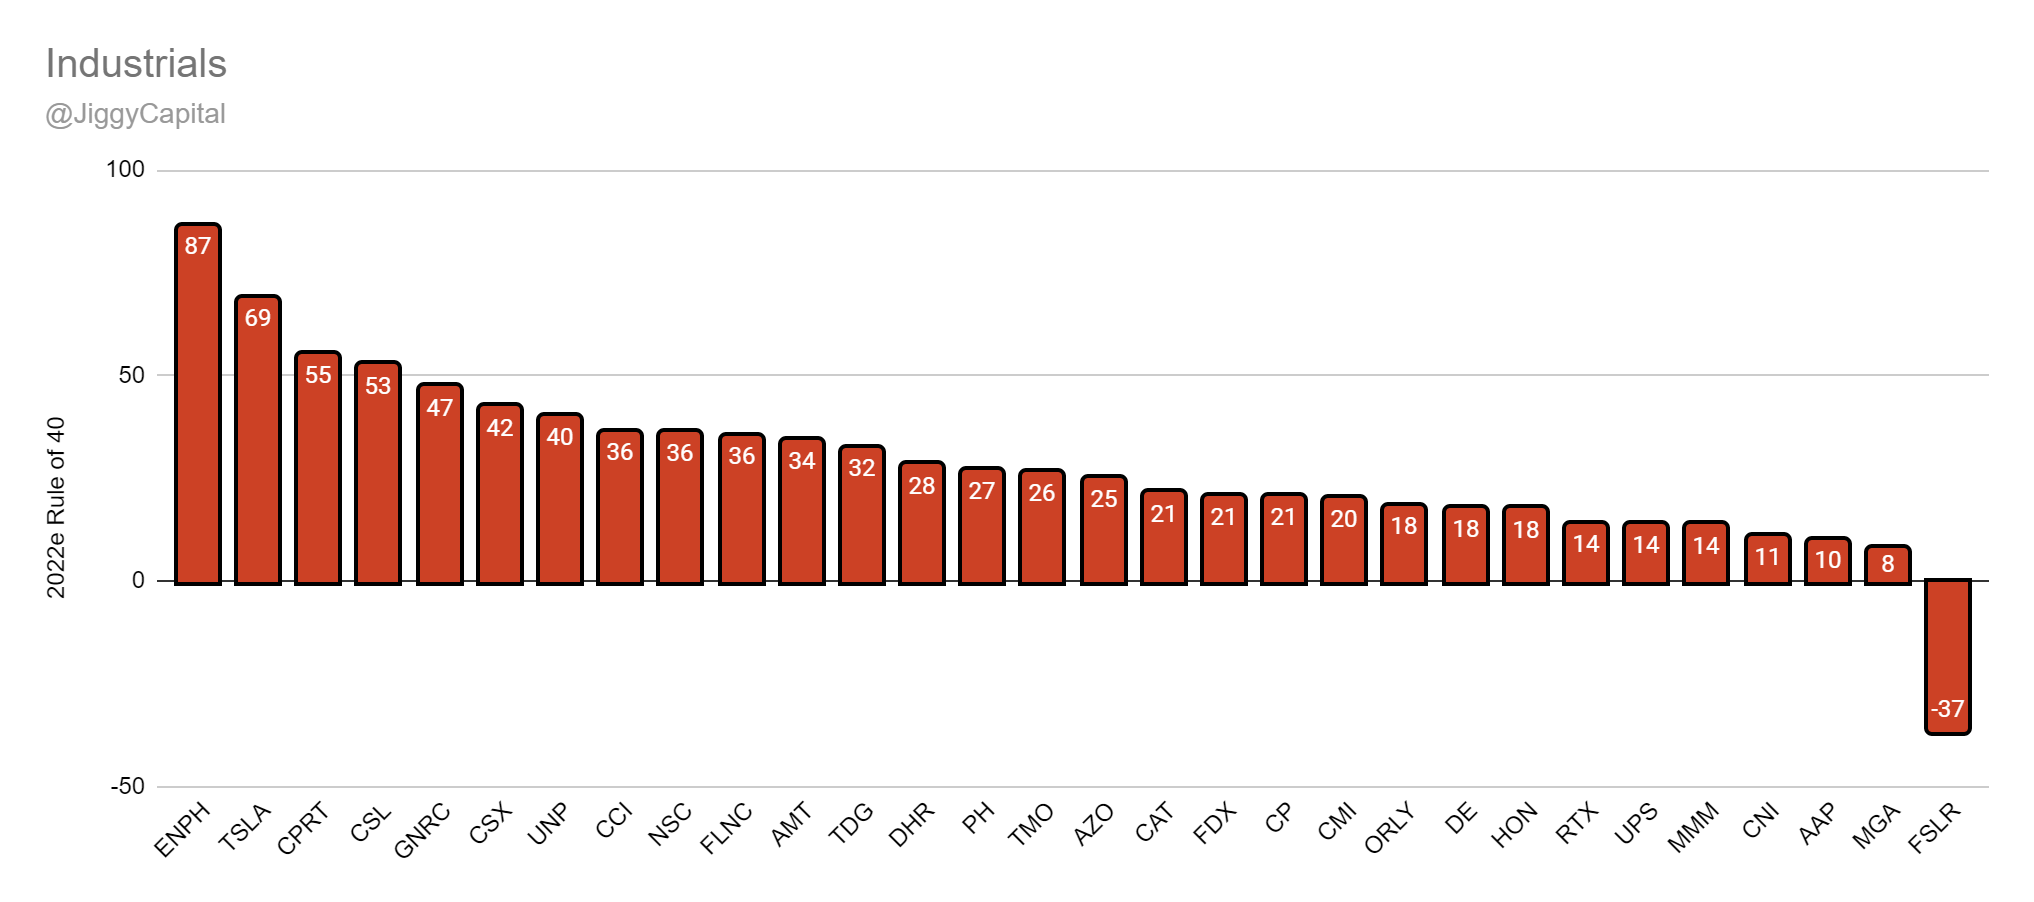
2022e Rule of 40 Scores:
Sector Stats:
Sector Highlights:
Best Gross Margins: American Tower — 71%
Best 2022e FCF Margins: Canadian Pacific Railway — 35%
Best 2022-2024 Projected Revenue CAGR: Stem — 94%
Best 2022e Rule of 40 Score: Stem — 179
Best 2022e FCF Yield %: Parker Hannifin — 6.3%
Best 2021 SBC as % Gross Profits: O’Reilly — 0%
Worst Gross Margins: Fluence Energy — 2%
Worst 2022e FCF Margins: Stem — -29%
Worst 2022-2024 Projected Revenue CAGR: Canadian National Railway — 0%
Worst 2022e Rule of 40 Score: First Solar — -37
Worst 2022e FCF Yield %: Fluence Energy — -8.3%
Worst 2021 SBC as % Gross Profits: Stem Inc — 391%
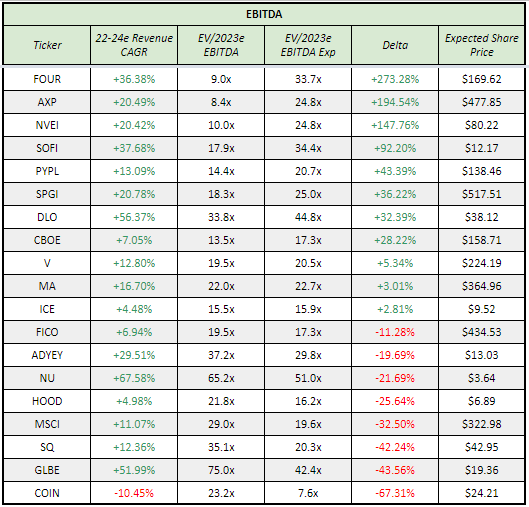
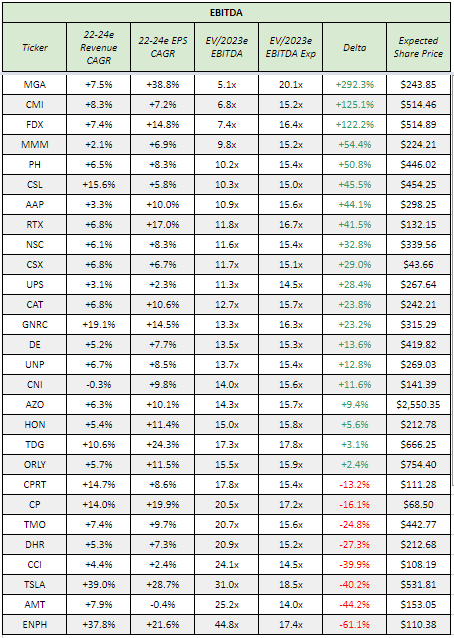
Scatter Plot Trend Line Error Percentage:
“Undervalued”:
Gross Profit: FedEx (241% Upside)
EBITDA: Magna (292% Upside)
“Overvalued”:
Gross Profit: Canadian National Railway (-70% Downside)
EBITDA: Enphase (-61% Downside)
Full Data:
Gross Profit:
EBITDA:
My Take: I’m not gonna lie, I mentioned hodgepodge describing the last group, but this is really one haha. I really just wanted to take a look how these kinds of companies (that have done extremely well in 2022) all shake out relative to each other on valuation and fundamentals, and thought I would share it with you all as well!
Already tying up this newsletter pushed me to start a small position in AutoZone, where all of the auto specialty retailer companies really blew my mind on how attractive their financial profile and fundamentals are.
Infrastructure Software
Group (34): Akamai AKAM 0.00%↑, Couchbase BASE 0.00%↑, Confluent CFLT 0.00%↑, Crowdstrike CRWD 0.00%↑, Datadog DDOG 0.00%↑, DigitalOcean DOCN 0.00%↑, Dynatrace DT 0.00%↑, Elastic ESTC 0.00%↑, ForgeRock FORG 0.00%↑, JFrog FROG 0.00%↑, Fastly FSLY 0.00%↑, Alphabet GOOG 0.00%↑, Gitlab GTLB 0.00%↑, HashiCorp HCP 0.00%↑, Informatica INFA 0.00%↑, Samsara IOT 0.00%↑, MongoDB MDB 0.00%↑, Cloudflare NET 0.00%↑, New Relic NEWR 0.00%↑, Okta OKTA 0.00%↑, Palo Alto Networks PANW 0.00%↑, UiPath PATH 0.00%↑, PagerDuty PD 0.00%↑, Palantir PLTR 0.00%↑, Qualys QLYS 0.00%↑, Rapid7 RPD 0.00%↑, SentinelOne S 0.00%↑, Snowflake SNOW 0.00%↑, Splunk SPLK 0.00%↑, Teradata TDC 0.00%↑, Twilio TWLO 0.00%↑, Unity U 0.00%↑, Zscaler ZS 0.00%↑
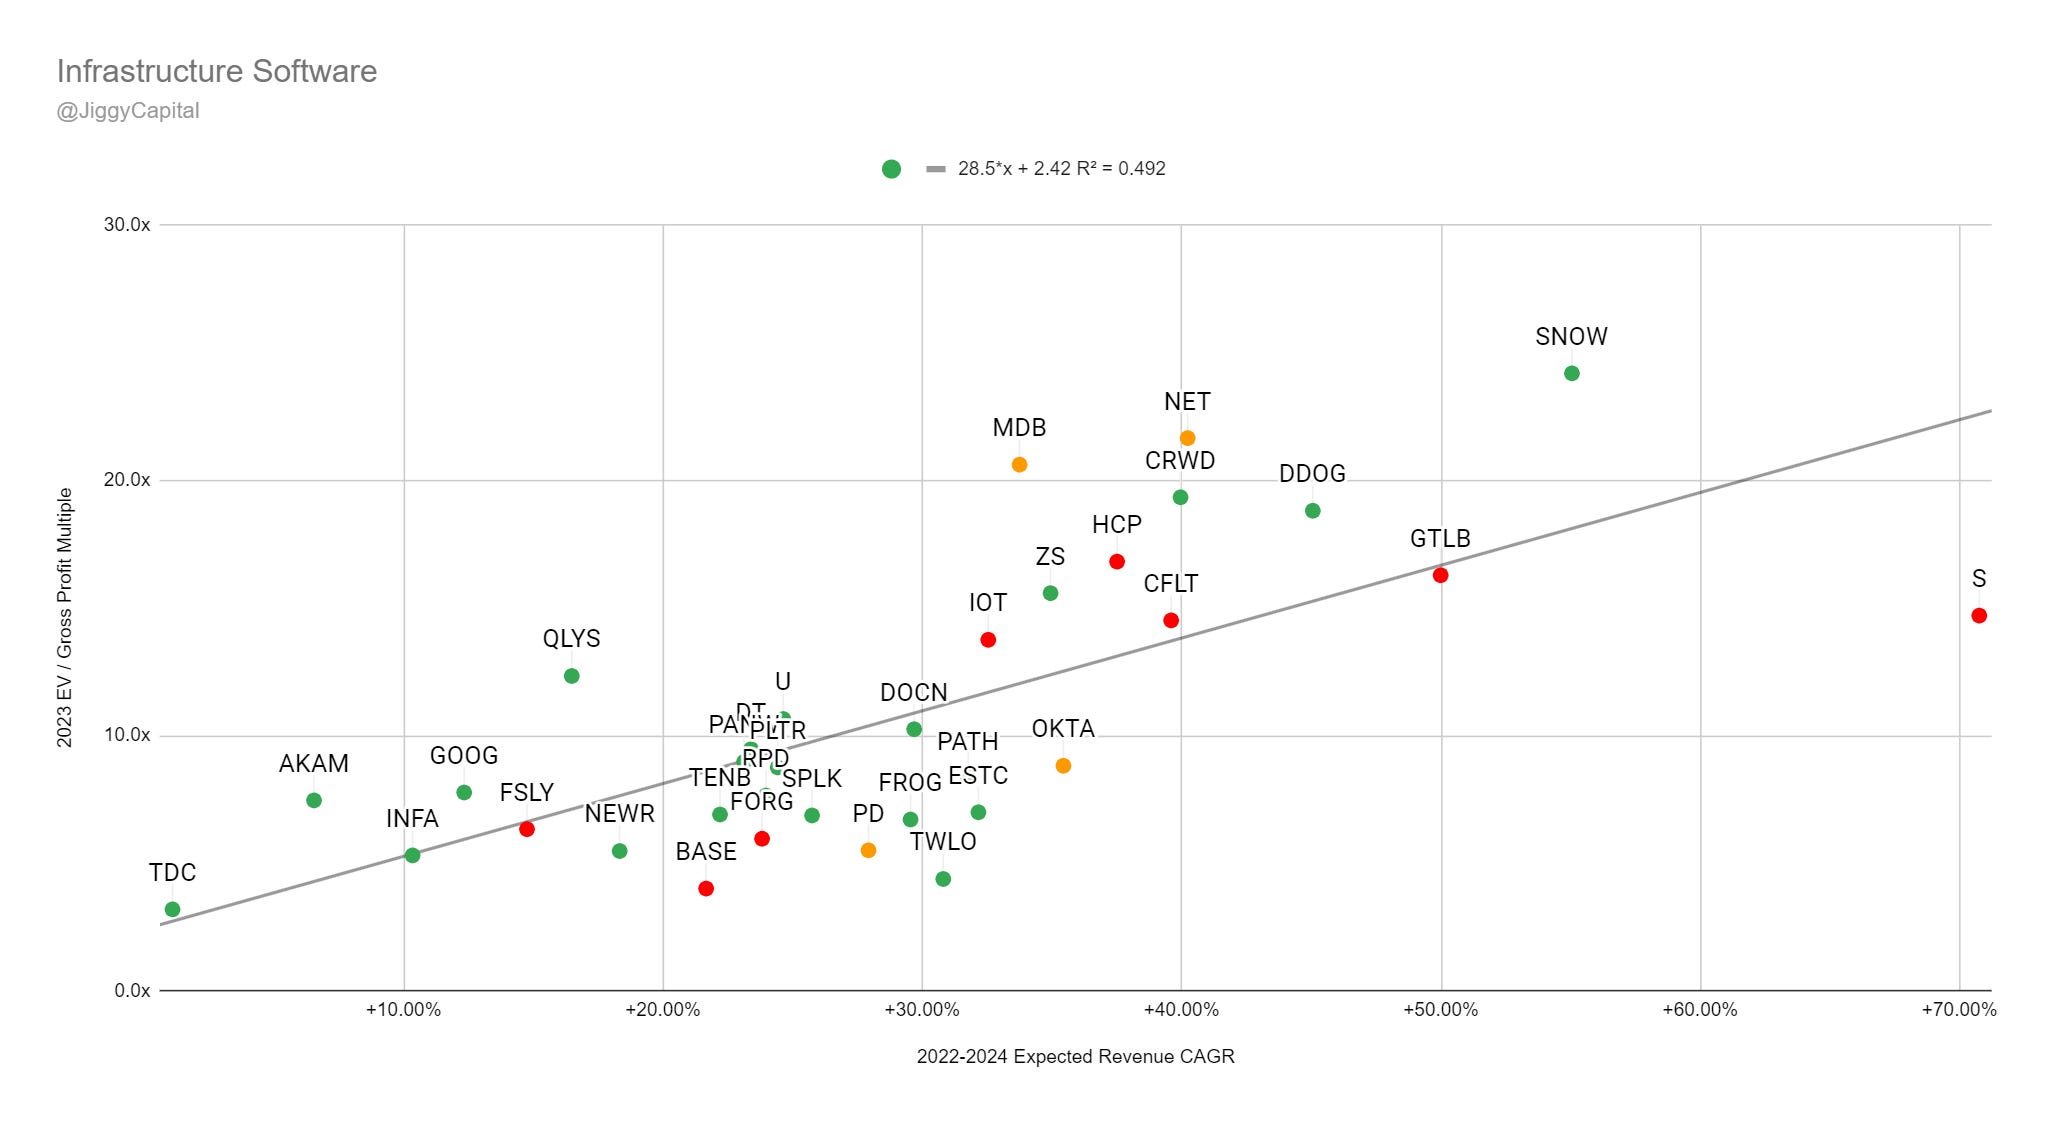
2022-2024 Revenue CAGR vs EV/2023 Gross Profit Multiple:
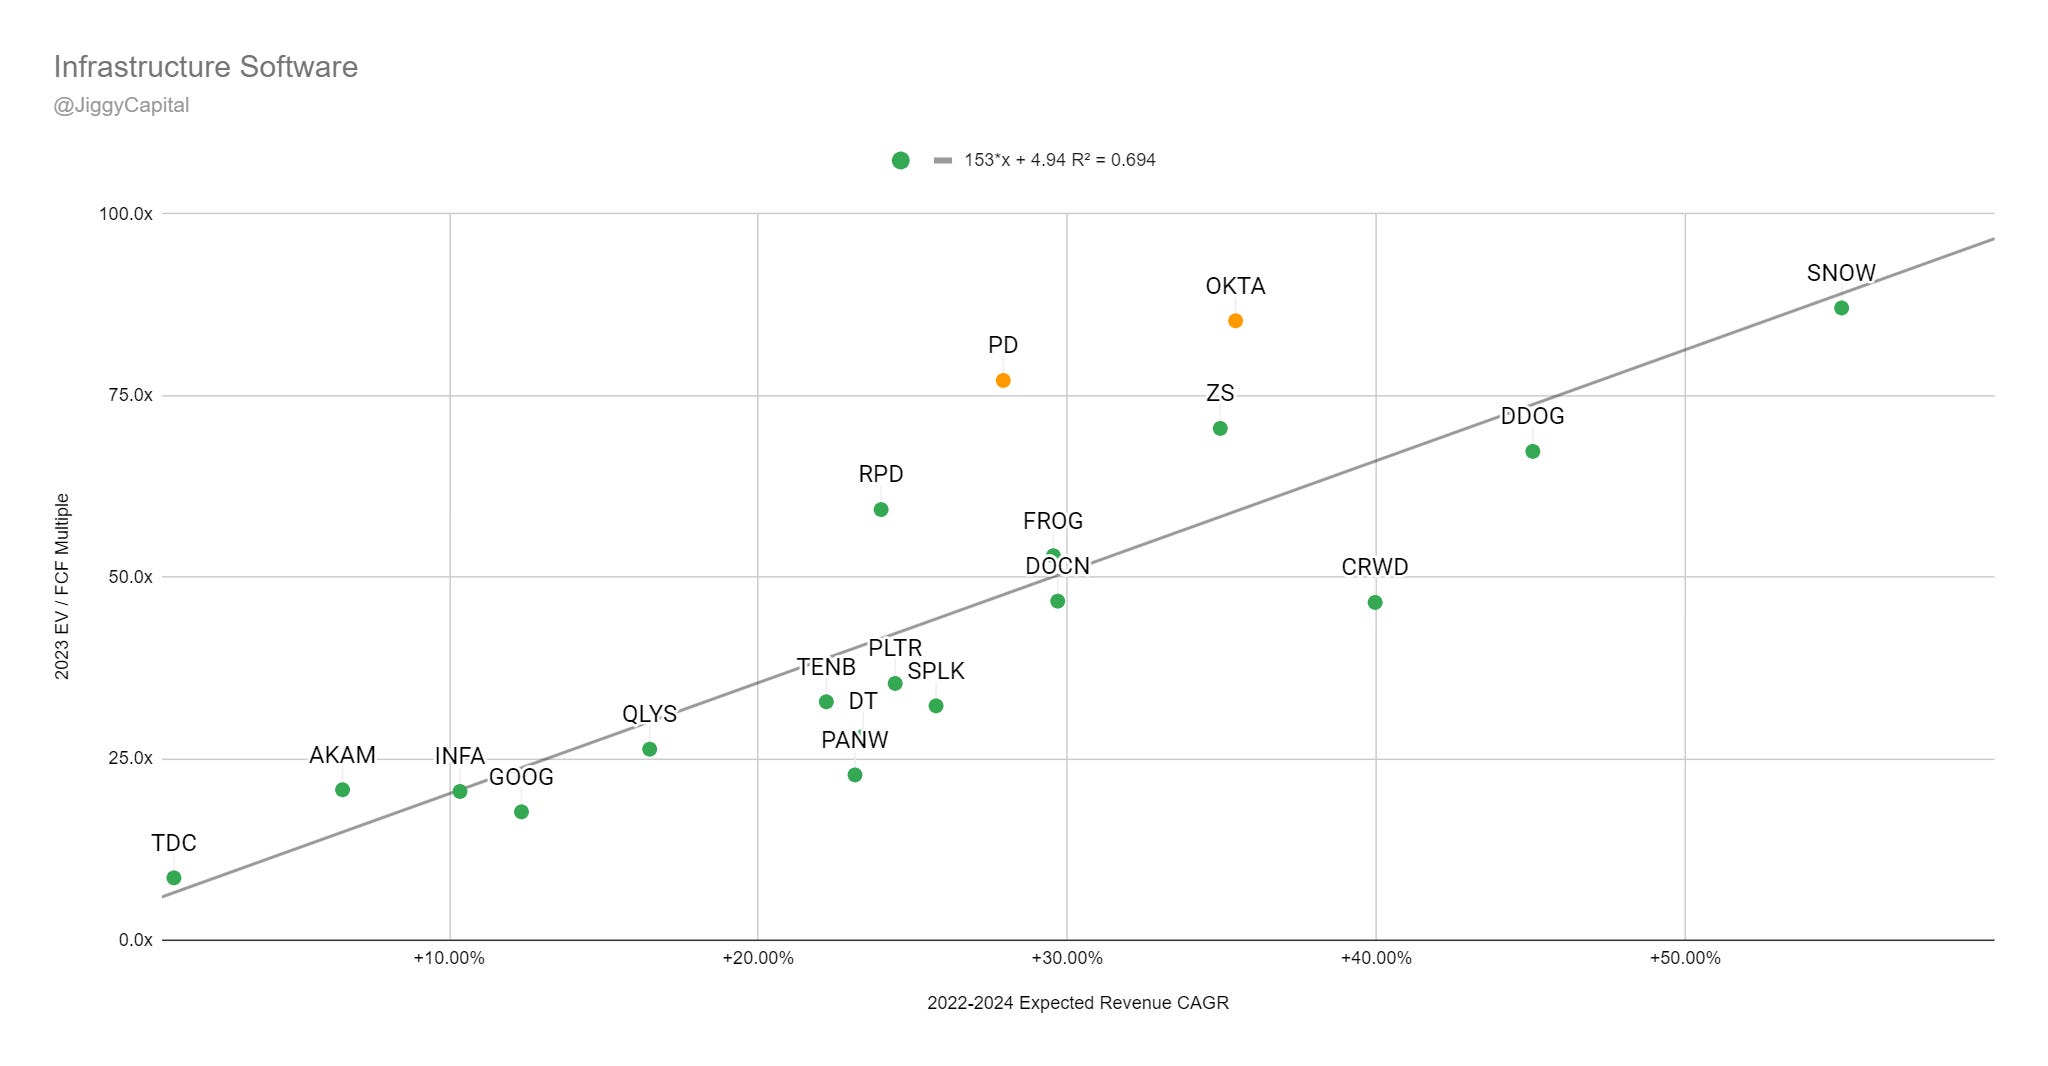
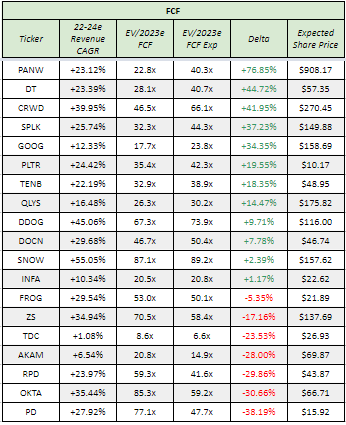
2022-2024 Revenue CAGR vs EV/2023 FCF Multiple:
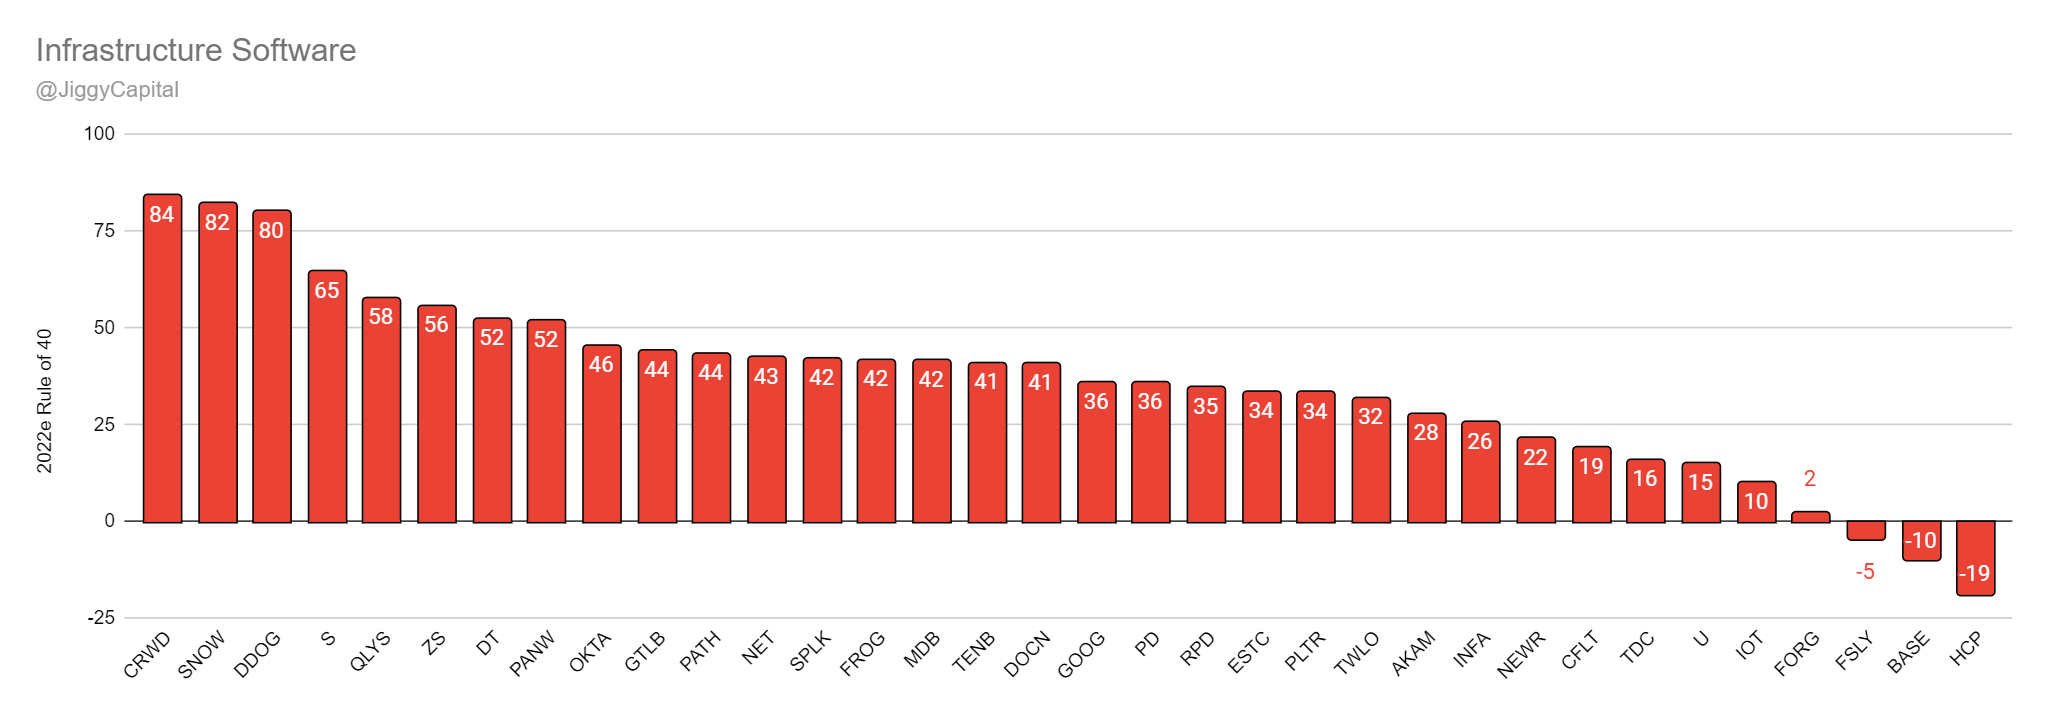
2022e Rule of 40 Scores:
Sector Stats:
Sector Highlights:
Best Gross Margins: UiPath — 89%
Best 2022e FCF Margins: Qualys — 39%
Best 2022-2024 Projected Revenue CAGR: SentinelOne — 70%
Best 2022e Rule of 40 Score: Crowdstrike — 84
Best 2022e FCF Yield %: Teradata — 10.7%
Best 2021 SBC as % Gross Profits: Informatica — 4%
Worst Gross Margins: Twilio — 49%
Worst 2022e FCF Margins: HashiCorp — -65%
Worst 2022-2024 Projected Revenue CAGR: Teradata — 3%
Worst 2022e Rule of 40 Score: HashiCorp — -19
Worst 2022e FCF Yield %: Couchbase — -8.3%
Worst 2021 SBC as % Gross Profits: HashiCorp — 117%
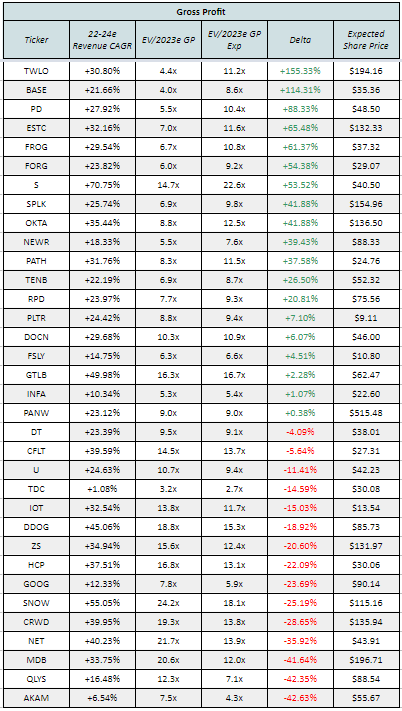
Scatter Plot Trend Line Error Percentage:
“Undervalued”:
Gross Profit: Twilio (155% Upside)
EBITDA: Palo Alto Networks (77% Upside)
“Overvalued”:
Gross Profit: Akamai (-43% Downside)
EBITDA: PagerDuty (-38% Downside)
Full Data:
Gross Profit:
FCF:
My Take: I don’t know about you all, but my figurative jaw dropped when I saw that Snowflake was unseated by Crowdstrike for the highest Rule of 40 score! Good for the fighting Kurtz's lol
Overall this was probably the most insightful sector grouping just because there is a pretty high correlation on the scatter plots. I would be lying if Palo Alto Networks didn’t catch my eye after this write up as well.
Internet
Group (30): Apple AAPL 0.00%↑, Airbnb ABNB 0.00%↑, DoorDash DASH 0.00%↑, Disney DIS 0.00%↑, DraftKings DKNG 0.00%↑, Doximity DOCS 0.00%↑, Duolingo DUOL 0.00%↑, Evolution $EVV.TY, Meta Platforms META 0.00%↑, Fiverr FVRR 0.00%↑, Genius Sports GENI 0.00%↑, Alphabet GOOG 0.00%↑, Lemonade LMND 0.00%↑, Weedmaps MAPS 0.00%↑, MGM MGM 0.00%↑, Netflix NFLX 0.00%↑, Penn National PENN 0.00%↑, Pinterest PINS 0.00%↑, Roblox RBLX 0.00%↑, Roku ROKU 0.00%↑, Sea Ltd SE 0.00%↑, Snap SNAP 0.00%↑, Sportradar SRAD 0.00%↑, Trade Desk TTD 0.00%↑, Twitter TWTR 0.00%↑, Uber UBER 0.00%↑, Unity U 0.00%↑, Upwork UPWK 0.00%↑
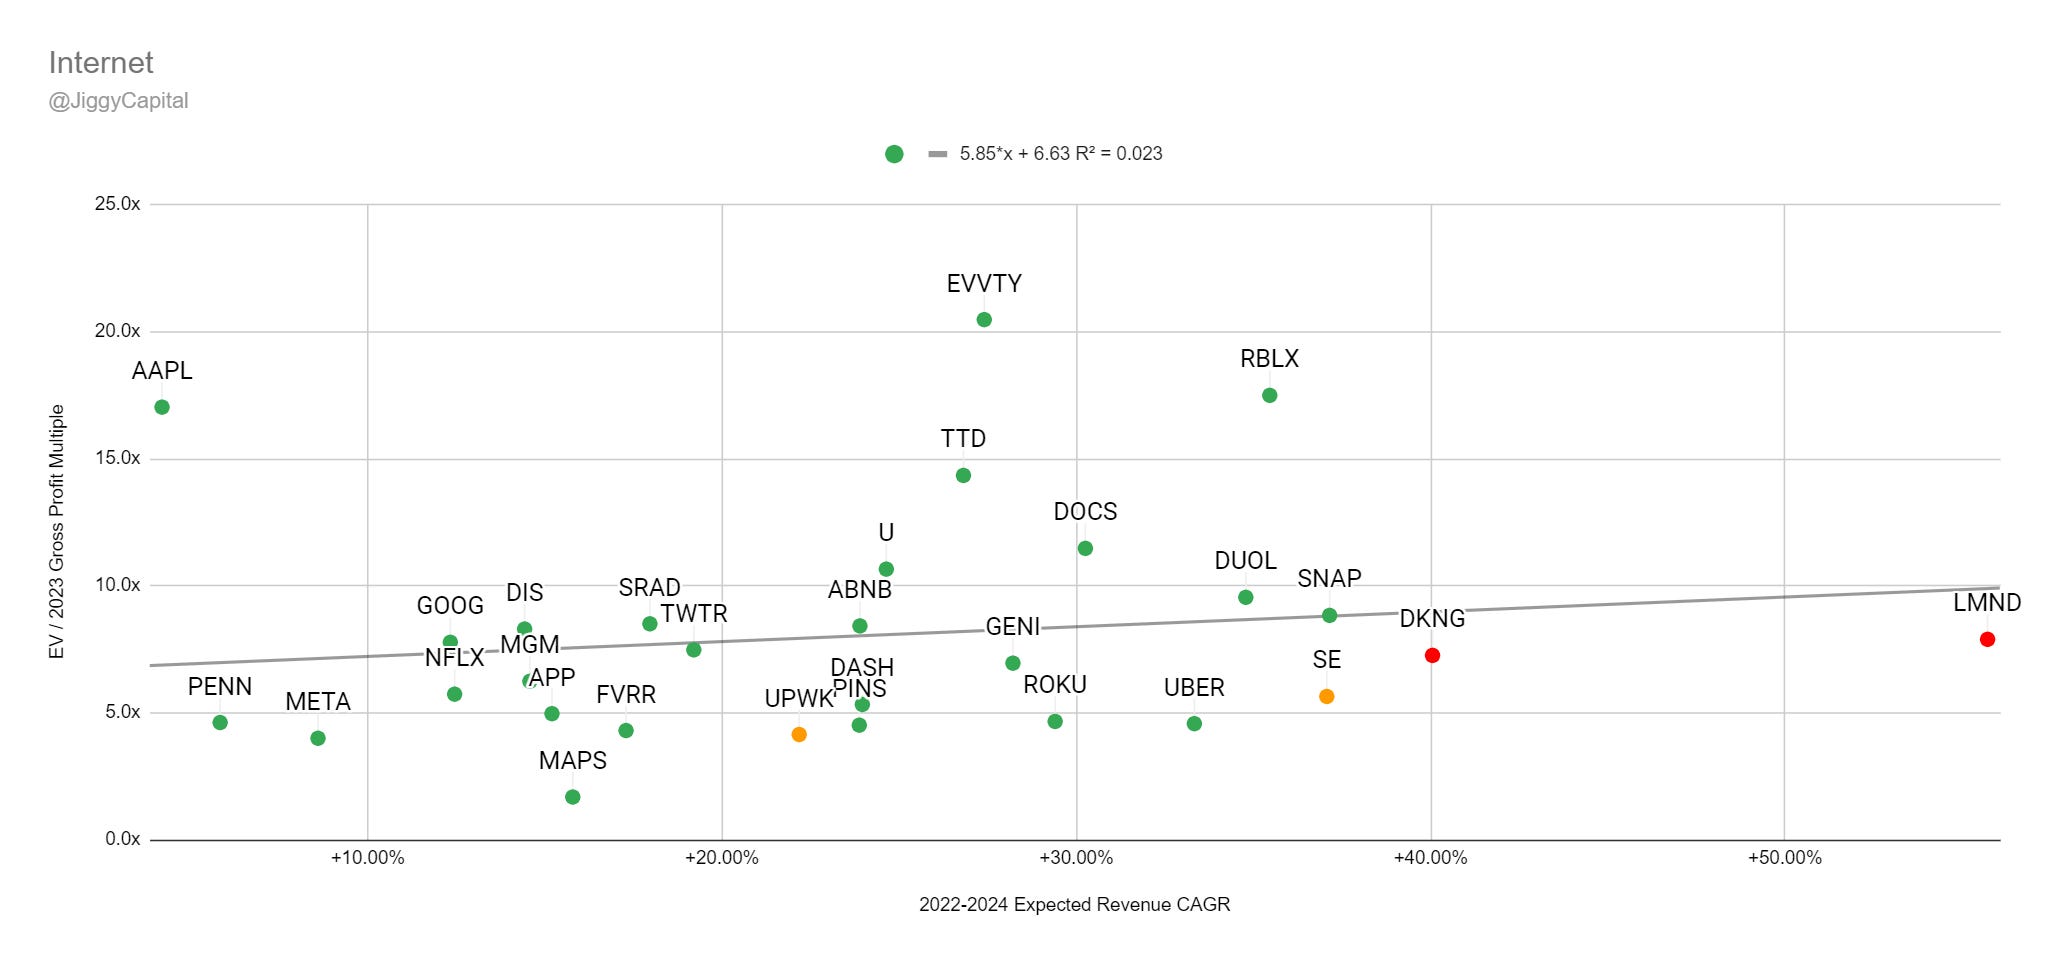
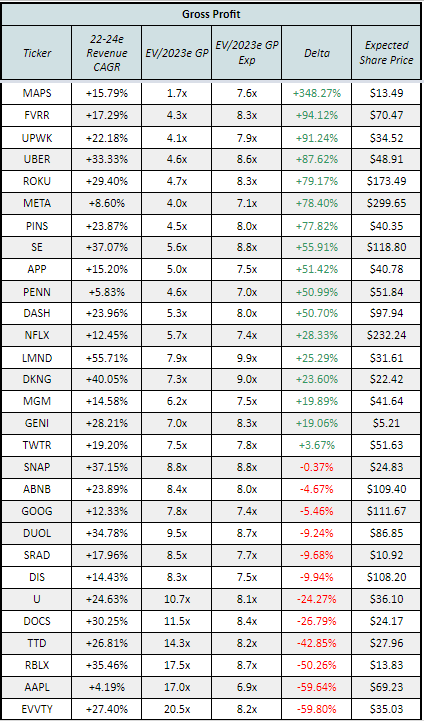
2022-2024 Revenue CAGR vs EV/2023 Gross Profit Multiple:
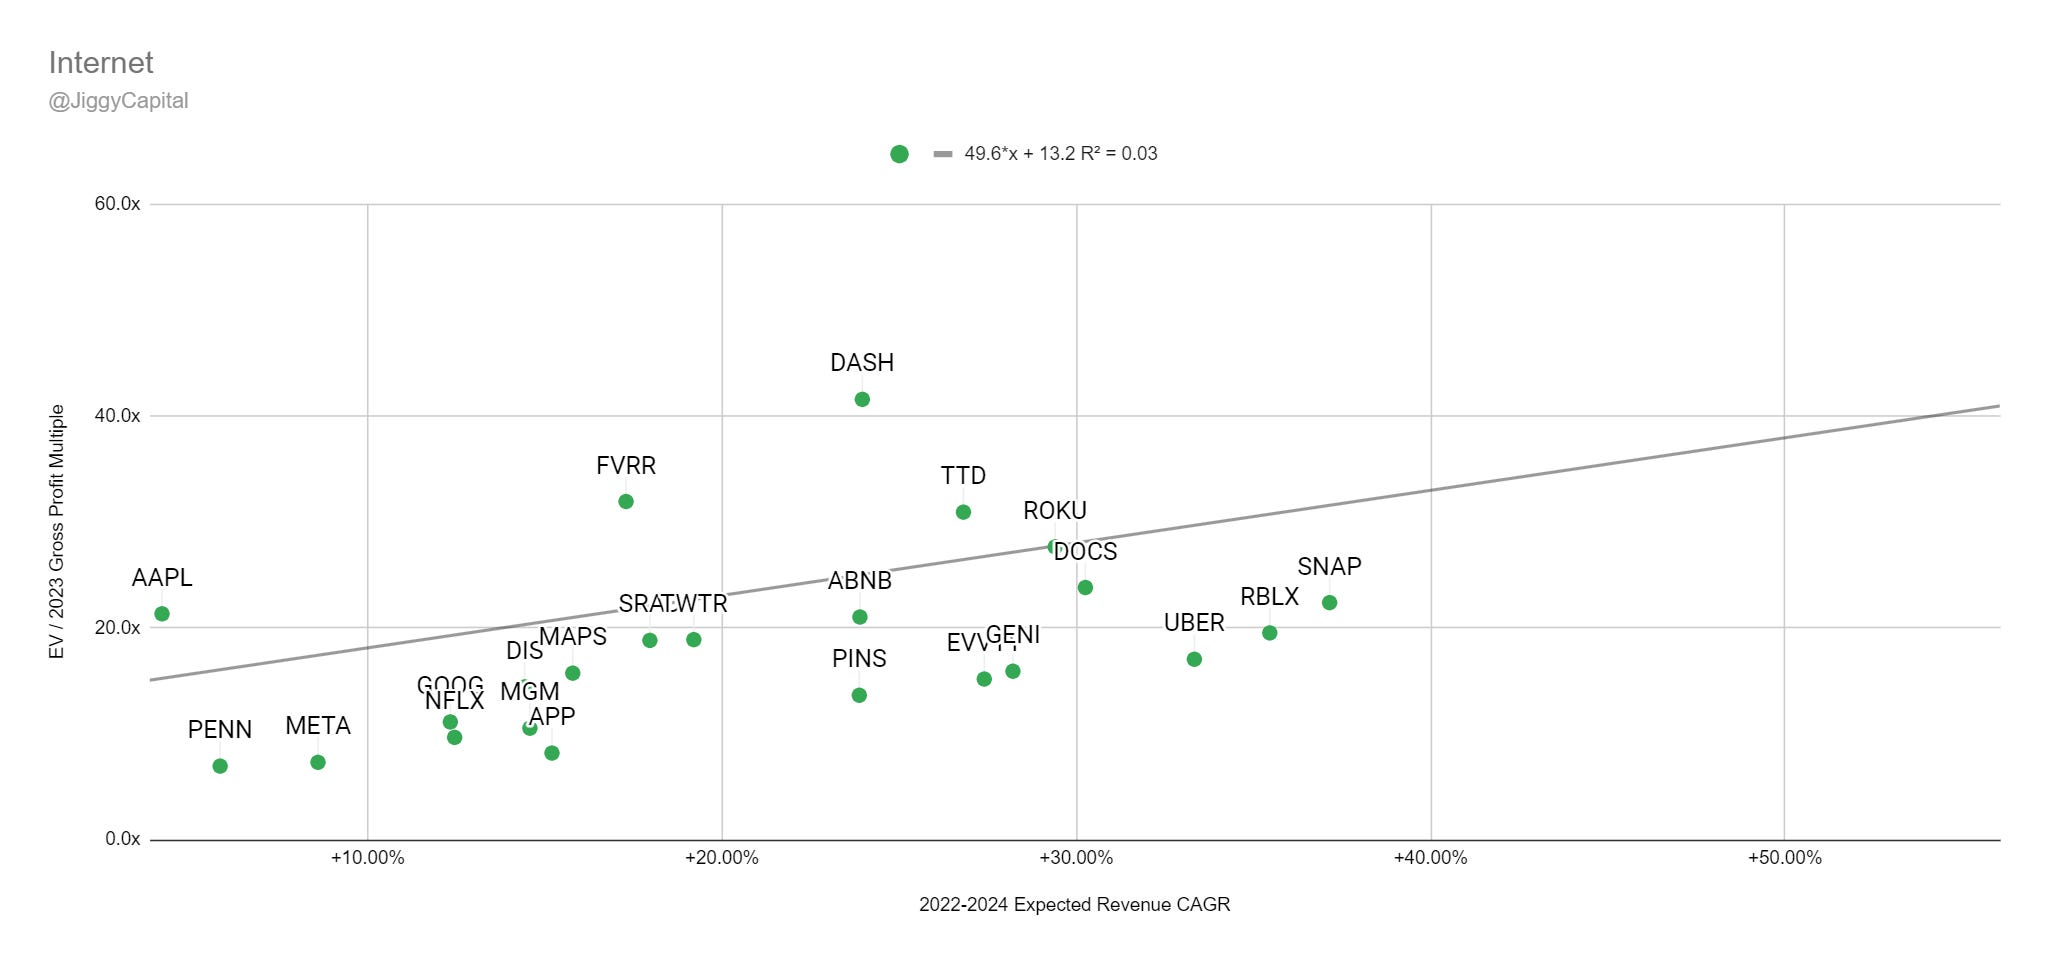
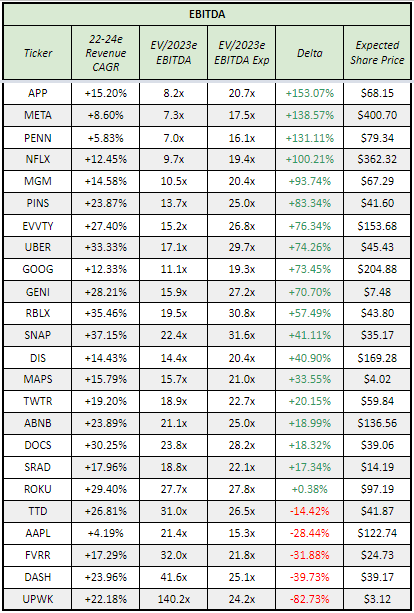
2022-2024 Revenue CAGR vs EV/2023 EBITDA Multiple:
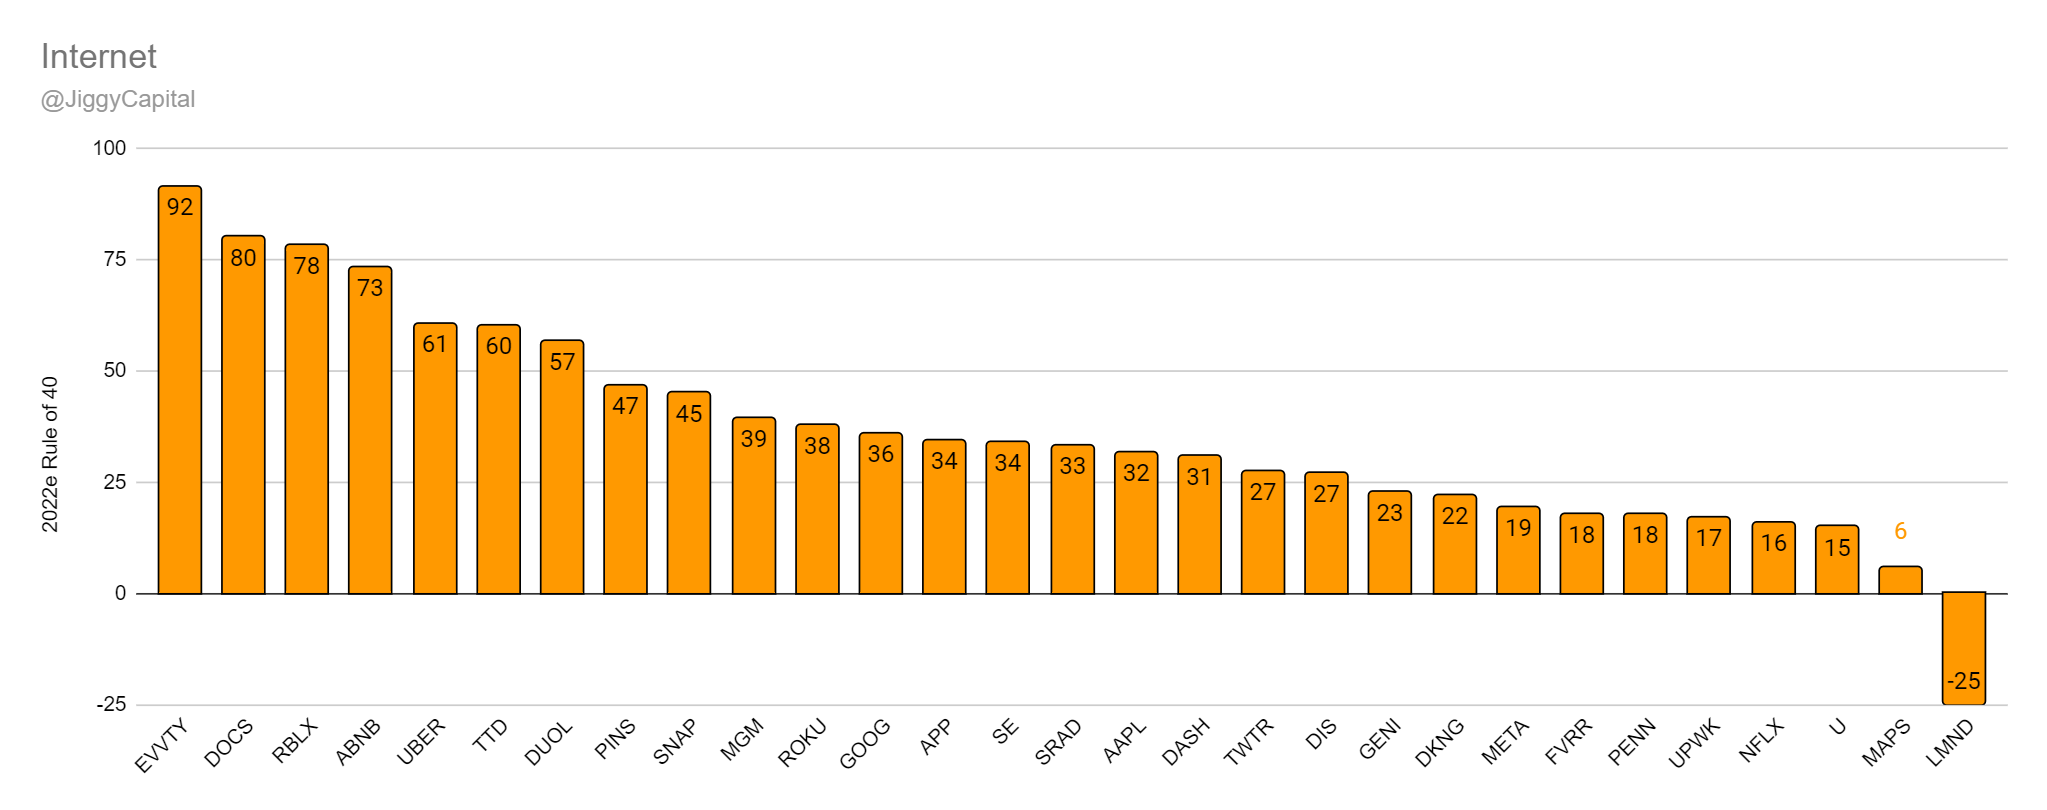
2022e Rule of 40 Scores:
Sector Stats:
Sector Highlights:
Best Gross Margins: Weedmaps — 96%
Best 2022e EBITDA Margins: Evolution Gaming — 70%
Best 2022-2024 Projected Revenue CAGR: Lemonade — 56%
Best 2022e Rule of 40 Score: Evolution Gaming — 92
Best 2022e FCF Yield %: AppLovin — 6.7%
Best 2021 SBC as % Gross Profits: Evolution Gaming — 0%
Worst Gross Margins: Roblox — 22%
Worst 2022e EBITDA Margins: Lemonade — -101%
Worst 2022-2024 Projected Revenue CAGR: Apple — 4%
Worst 2022e Rule of 40 Score: Lemonade — -25
Worst 2022e FCF Yield %: Lemonade — -18.7%
Worst 2021 SBC as % Gross Profits: Genius Sports — 789%
Scatter Plot Trend Line Error Percentage:
“Undervalued”:
Gross Profit: Weedmaps (348% Upside)
EBITDA: AppLovin (153% Upside)
“Overvalued”:
Gross Profit: Evolution Gaming (-60% Downside)
EBITDA: Upwork (-83% Downside)
Full Data:
Gross Profit:
EBITDA:
My Take: The internet group is still sadly an absolute investor wasteland, and it’s again been amazing to see the multiple compression in the group as well from the first Sector Analysis edition I did.
Again, I’ve entered a new position after typing up this write up in Meta Platforms, because damn has this thing gotten cheap for still the absurd money it spits out. Google is the other one I own from the group and aside from The Trade Desk, are really the only interesting ones to me.
Semiconductors
Group (18): Analog Devices ADI 0.00%↑, Applied Materials AMAT 0.00%↑, Advanced Micro Devices AMD 0.00%↑, ASML ASML 0.00%↑, Broadcom AVGO 0.00%↑, Cadence Design Systems CDNS 0.00%↑, Globalfoundries GFS 0.00%↑, Intel INTC 0.00%↑, KLA Corp KLAC 0.00%↑, Lam Research LRCX 0.00%↑, Marvell MRVL 0.00%↑, Micron MU 0.00%↑, Nvidia NVDA 0.00%↑, NXP NXPI 0.00%↑, Qualcomm QCOM 0.00%↑, Synopsys SNPS 0.00%↑, Taiwan Semiconductor TSM 0.00%↑, Texas Instruments TXN 0.00%↑
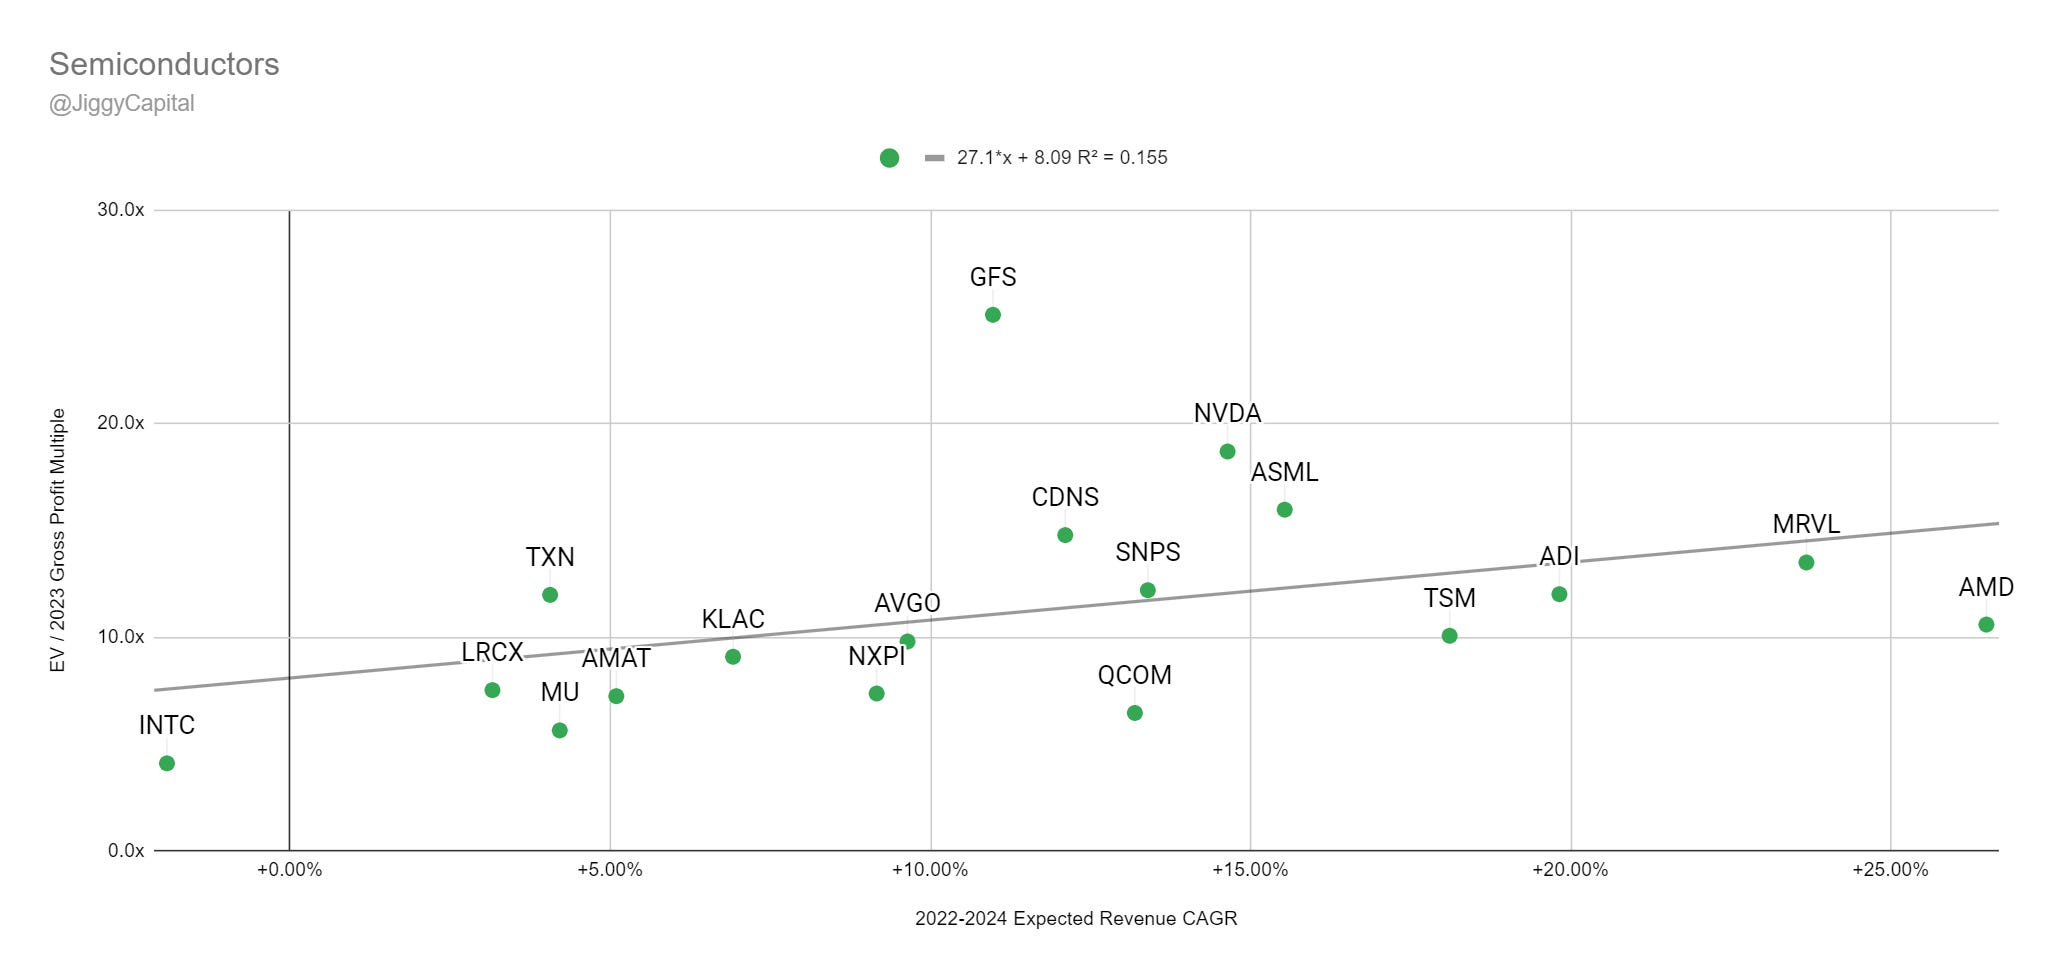
2022-2024 Revenue CAGR vs EV/2023 Gross Profit Multiple:
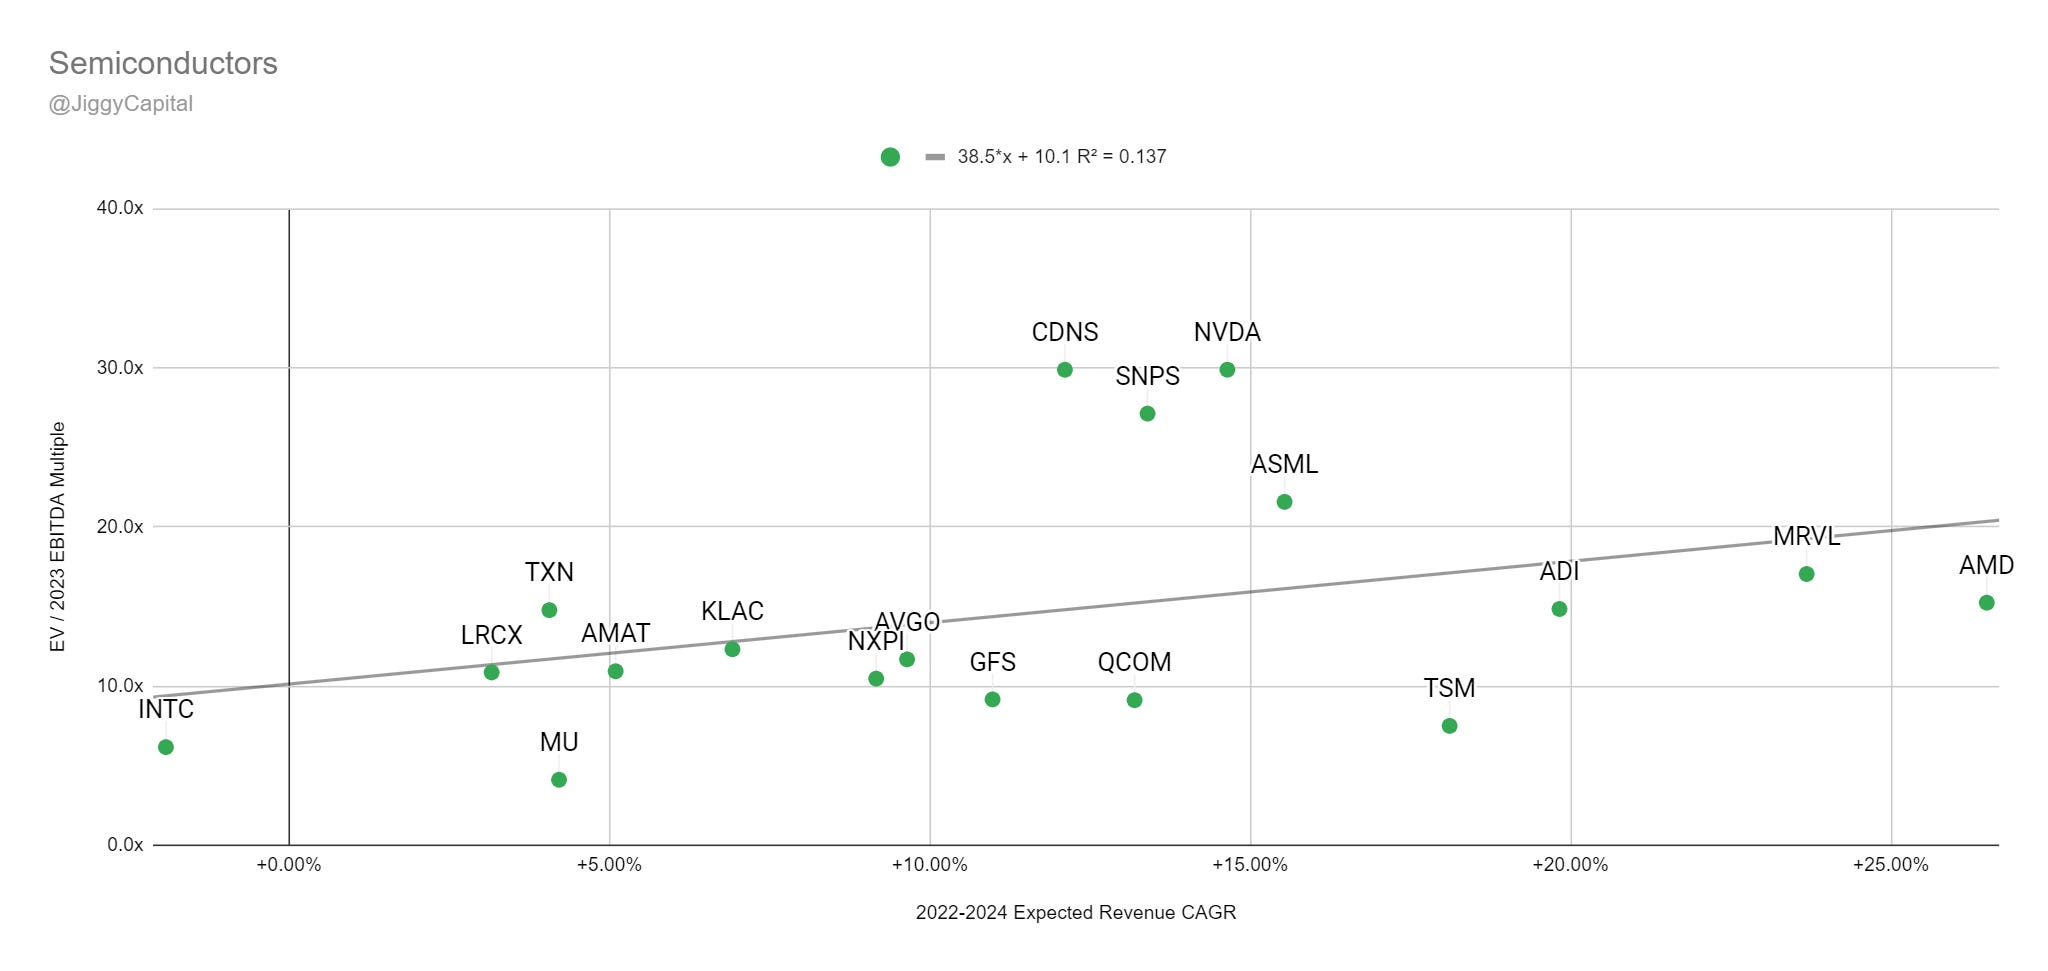
2022-2024 Revenue CAGR vs EV/2023 EBITDA Multiple:
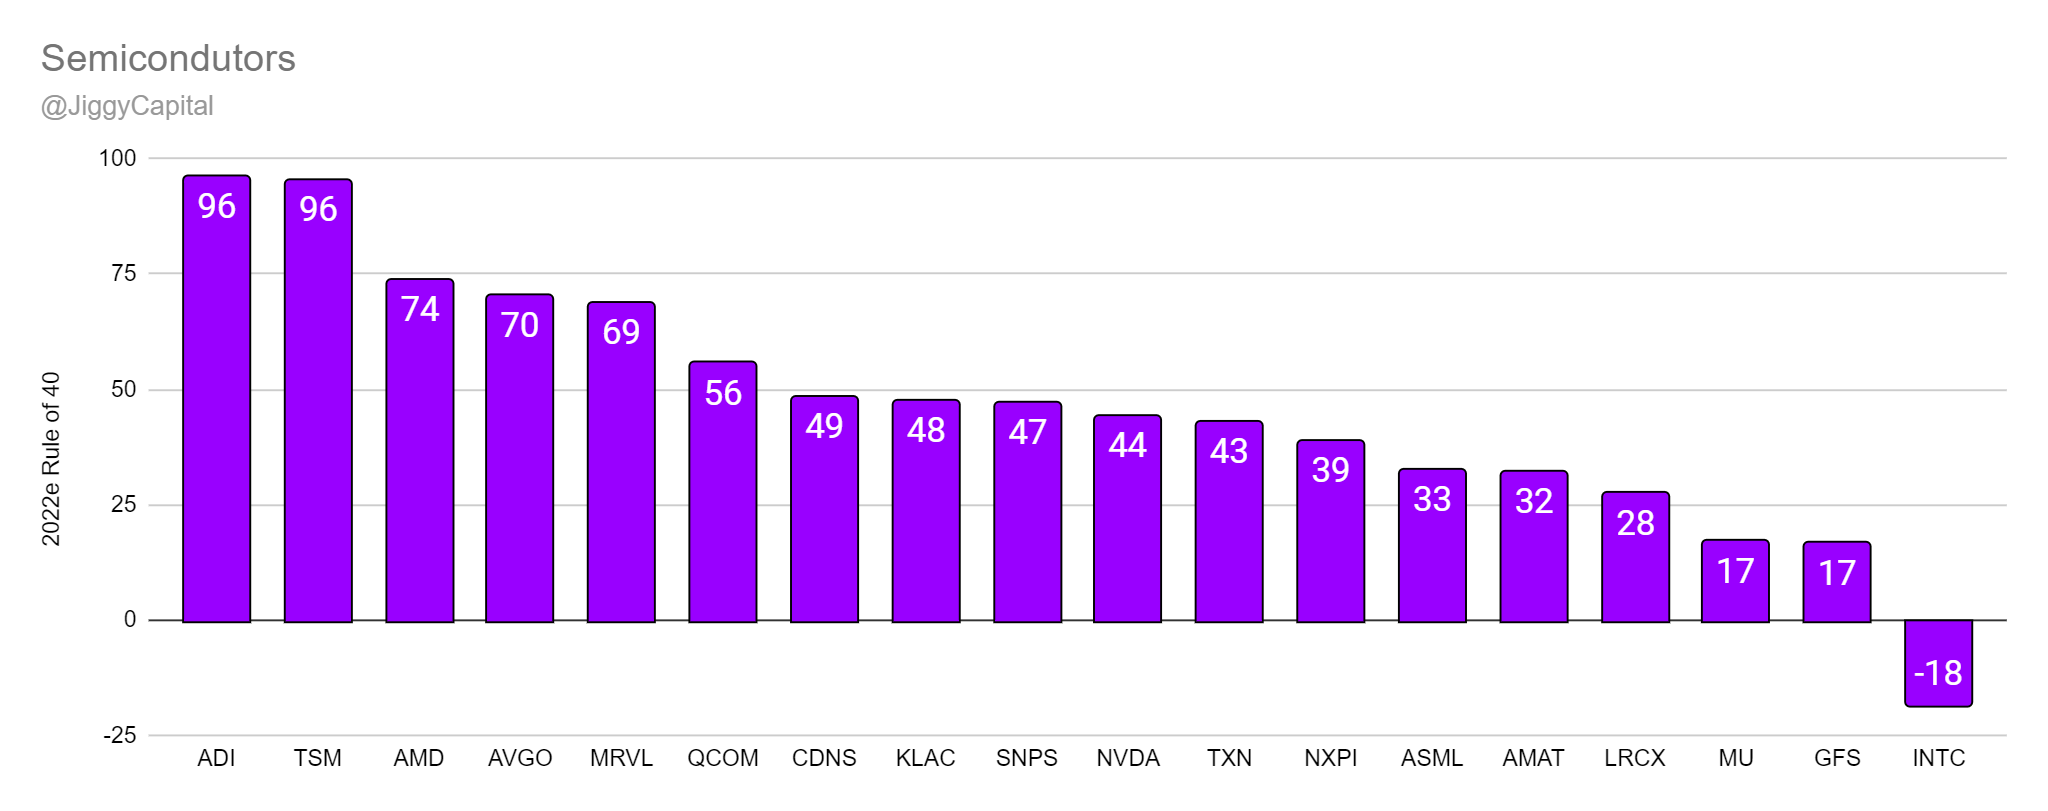
2022e Rule of 40 Scores:
Sector Stats:
Sector Highlights:
Best Gross Margins: Cadence Design Systems — 90%
Best 2022e EBITDA Margins: Taiwan Semiconductor — 69%
Best 2022-2024 Projected Revenue CAGR: AMD — 26%
Best 2022e Rule of 40 Score: Taiwan Semiconductor & Analog Devices — 96
Best 2022e FCF Yield %: Taiwan Semiconductor — 11.9%
Best 2021 SBC as % Gross Profits: Taiwan Semiconductor — 0%
Worst Gross Margins: Global Foundries — 15%
Worst 2022e EBITDA Margins: Nvidia — 27%
Worst 2022-2024 Projected Revenue CAGR: Intel — -2%
Worst 2022e Rule of 40 Score: Intel — -18
Worst 2022e FCF Yield %: Global Foundries — -1.4%
Worst 2021 SBC as % Gross Profits: Global Foundries — 23%
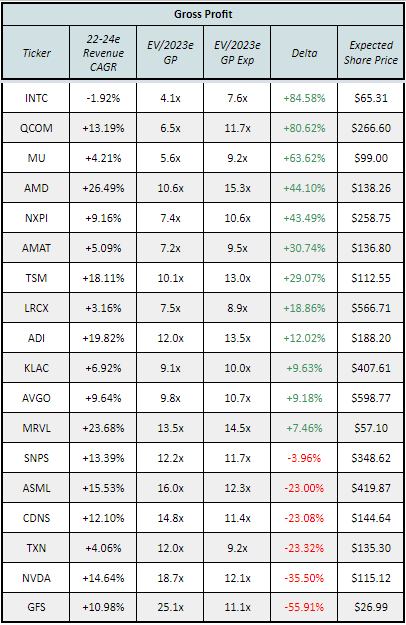
Scatter Plot Trend Line Error Percentage:
“Undervalued”:
Gross Profit: Intel (85% Upside)
EBITDA: Micron (183% Upside)
“Overvalued”:
Gross Profit: Global Foundries (-56% Downside)
EBITDA: Cadence Design Systems (-51% Downside)
Full Data:
Gross Profit:
FCF:
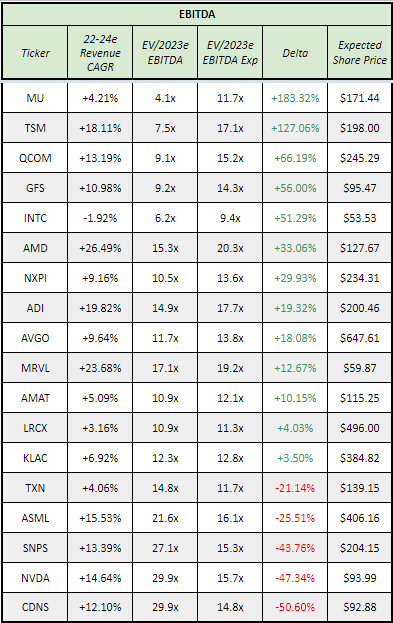
My Take: Before I started compiling the data, I figured that Intel was going to look really great on every metric because of how terrible the company has performed and executed. I almost want to suggest you should just take them out of the equation for this exercise haha.
It’s pretty incredible to me that Nvidia has slashed their numbers to hard that now they have the lowest projected EBITDA margins for 2022!! Also worth mentioning that the EDA players (SNPS & CDNS) are more software companies serving the semiconductor industry so they’re not a perfect comp.
Software
Group (77): Adobe ADBE 0.00%↑, Autodesk ADSK 0.00%↑, Akamai AKAM 0.00%↑, Amplitude AMPL 0.00%↑, Asana ASAN 0.00%↑, Couchbase BASE 0.00%↑, Bigcommerce BIGC 0.00%↑, Bill.com BILL 0.00%↑, Blackline BL 0.00%↑, Braze BRZE 0.00%↑, Ceridian CDAY 0.00%↑, Confluent CFLT 0.00%↑, Coupa COUP 0.00%↑, Salesforce CRM 0.00%↑, Crowdstrike CRWD 0.00%↑, Sprinklr CXM 0.00%↑, Datadog DDOG 0.00%↑, DigitalOcean DOCN 0.00%↑, DocuSign DOCU 0.00%↑, Dynatrace DT 0.00%↑, Elastic ESTC 0.00%↑, Expensify EXFY 0.00%↑, Five9 FIVN 0.00%↑, ForgeRock FORG 0.00%↑, JFrog FROG 0.00%↑, Freshworks FRSH 0.00%↑, Fastly FSLY 0.00%↑, Alphabet GOOG 0.00%↑, Gitlab GTLB 0.00%↑, Hashicorp HCP 0.00%↑, HubSpot HUBS 0.00%↑, Informatica INFA 0.00%↑, Intuit INTU 0.00%↑, Samsara IOT 0.00%↑, Lightspeed LSPD 0.00%↑, MongoDB MDB 0.00%↑, Monday.com MNDY 0.00%↑, Microsoft MSFT 0.00%↑, Cloudflare NET 0.00%↑, New Relic NEWR 0.00%↑, Nice NICE 0.00%↑, ServiceNow NOW 0.00%↑, Okta OKTA 0.00%↑, Olo OLO 0.00%↑, Oracle ORCL 0.00%↑, Palo Alto Networks PANW 0.00%↑, UiPath PATH 0.00%↑, Paycom PAYC 0.00%↑, Paychex PAYX 0.00%↑, Procore PCOR 0.00%↑, Paylocity PCTY 0.00%↑, Pagerduty PD 0.00%↑, Palantir PLTR 0.00%↑, Powerschool PWSC 0.00%↑, Qualys QLYS 0.00%↑, RingCentral RNG 0.00%↑, Rapid7 RPD 0.00%↑, SentinelOne S 0.00%↑, Semrush SEMR 0.00%↑, Shopify SHOP 0.00%↑, Smartsheet SMAR 0.00%↑, Snowflake SNOW 0.00%↑, Splunk SPLK 0.00%↑, Sprout Social SPT 0.00%↑, Squarespace SQSP 0.00%↑, Teradata TDC 0.00%↑, Atlassian TEAM 0.00%↑, Tenable TENB 0.00%↑, Twilio TWLO 0.00%↑, Tyler Technologies TYL 0.00%↑, Unity U 0.00%↑, Veeva VEEV 0.00%↑, Workday WDAY 0.00%↑, ZoomInfo ZI 0.00%↑, Zoom Video ZM 0.00%↑, Zscaler ZS 0.00%↑
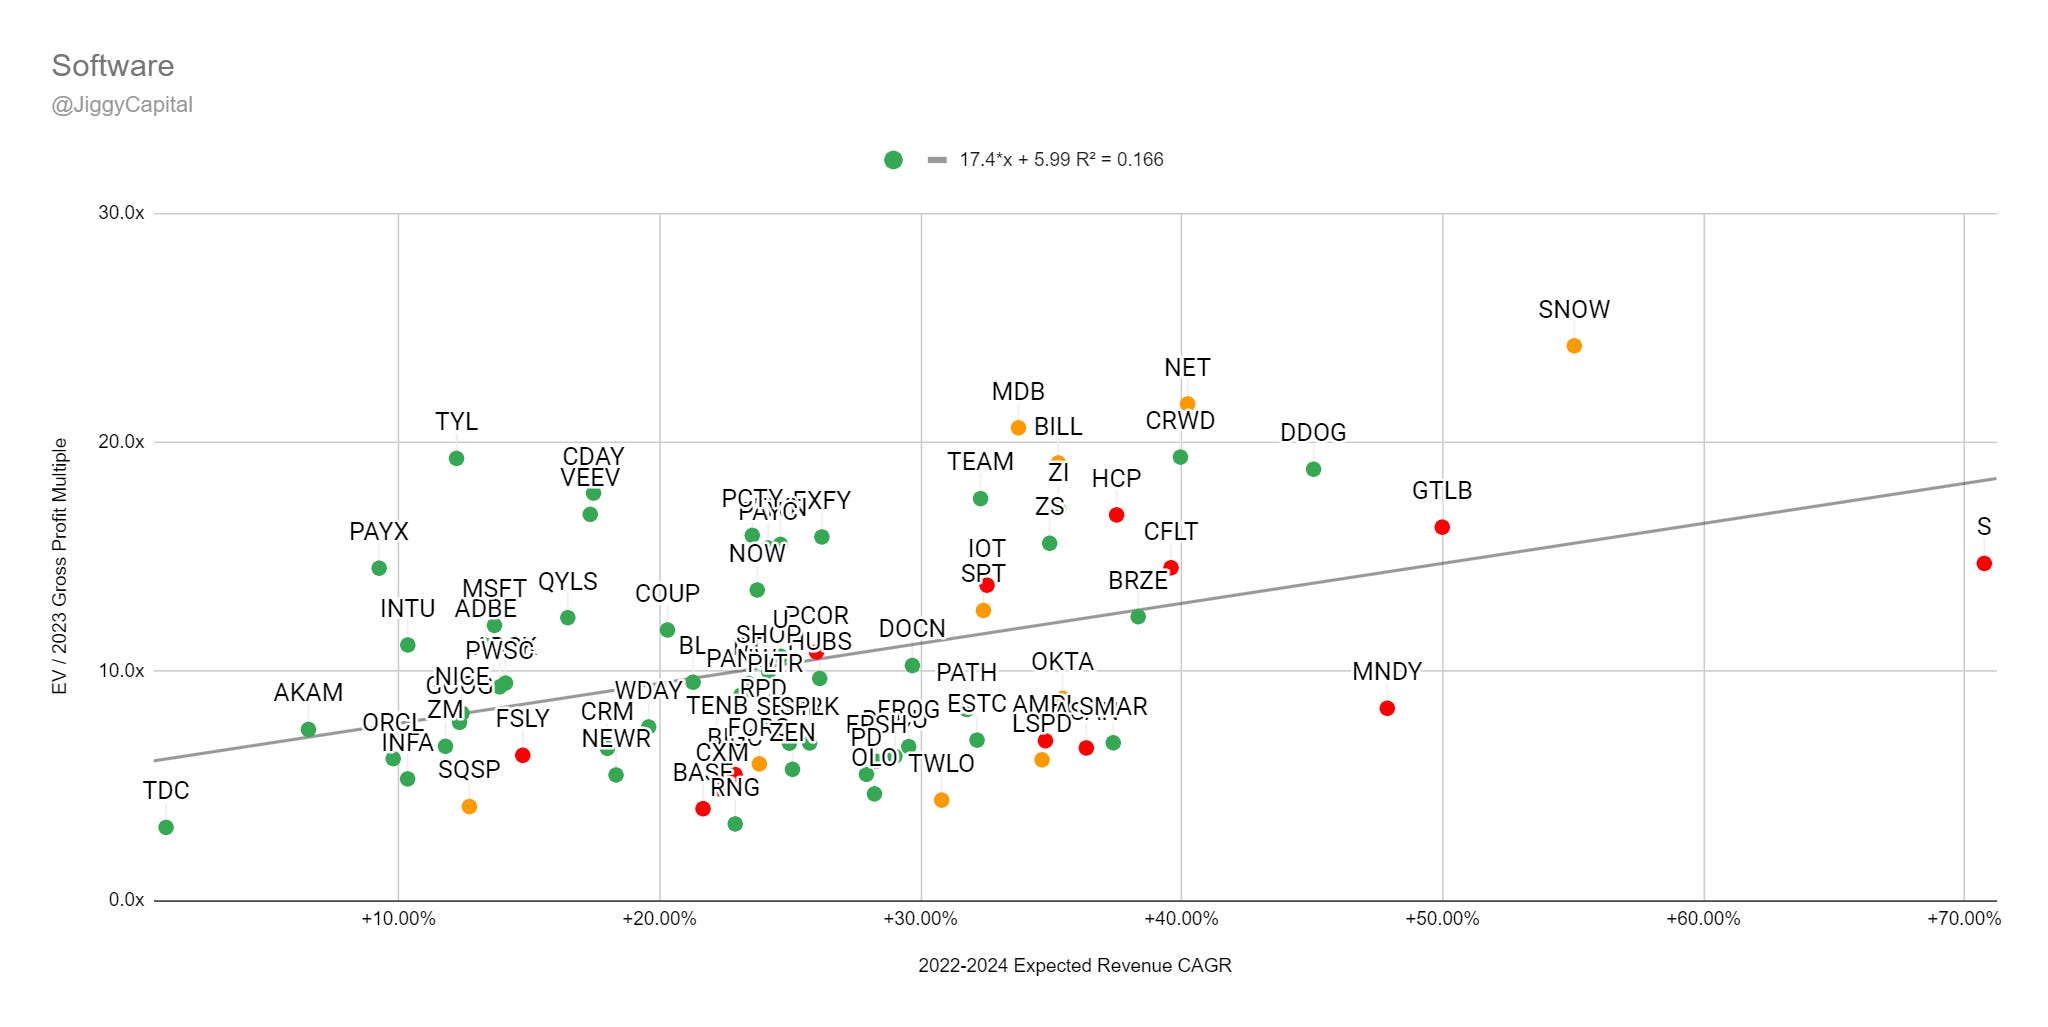
2022-2024 Revenue CAGR vs EV/2023 Gross Profit Multiple:
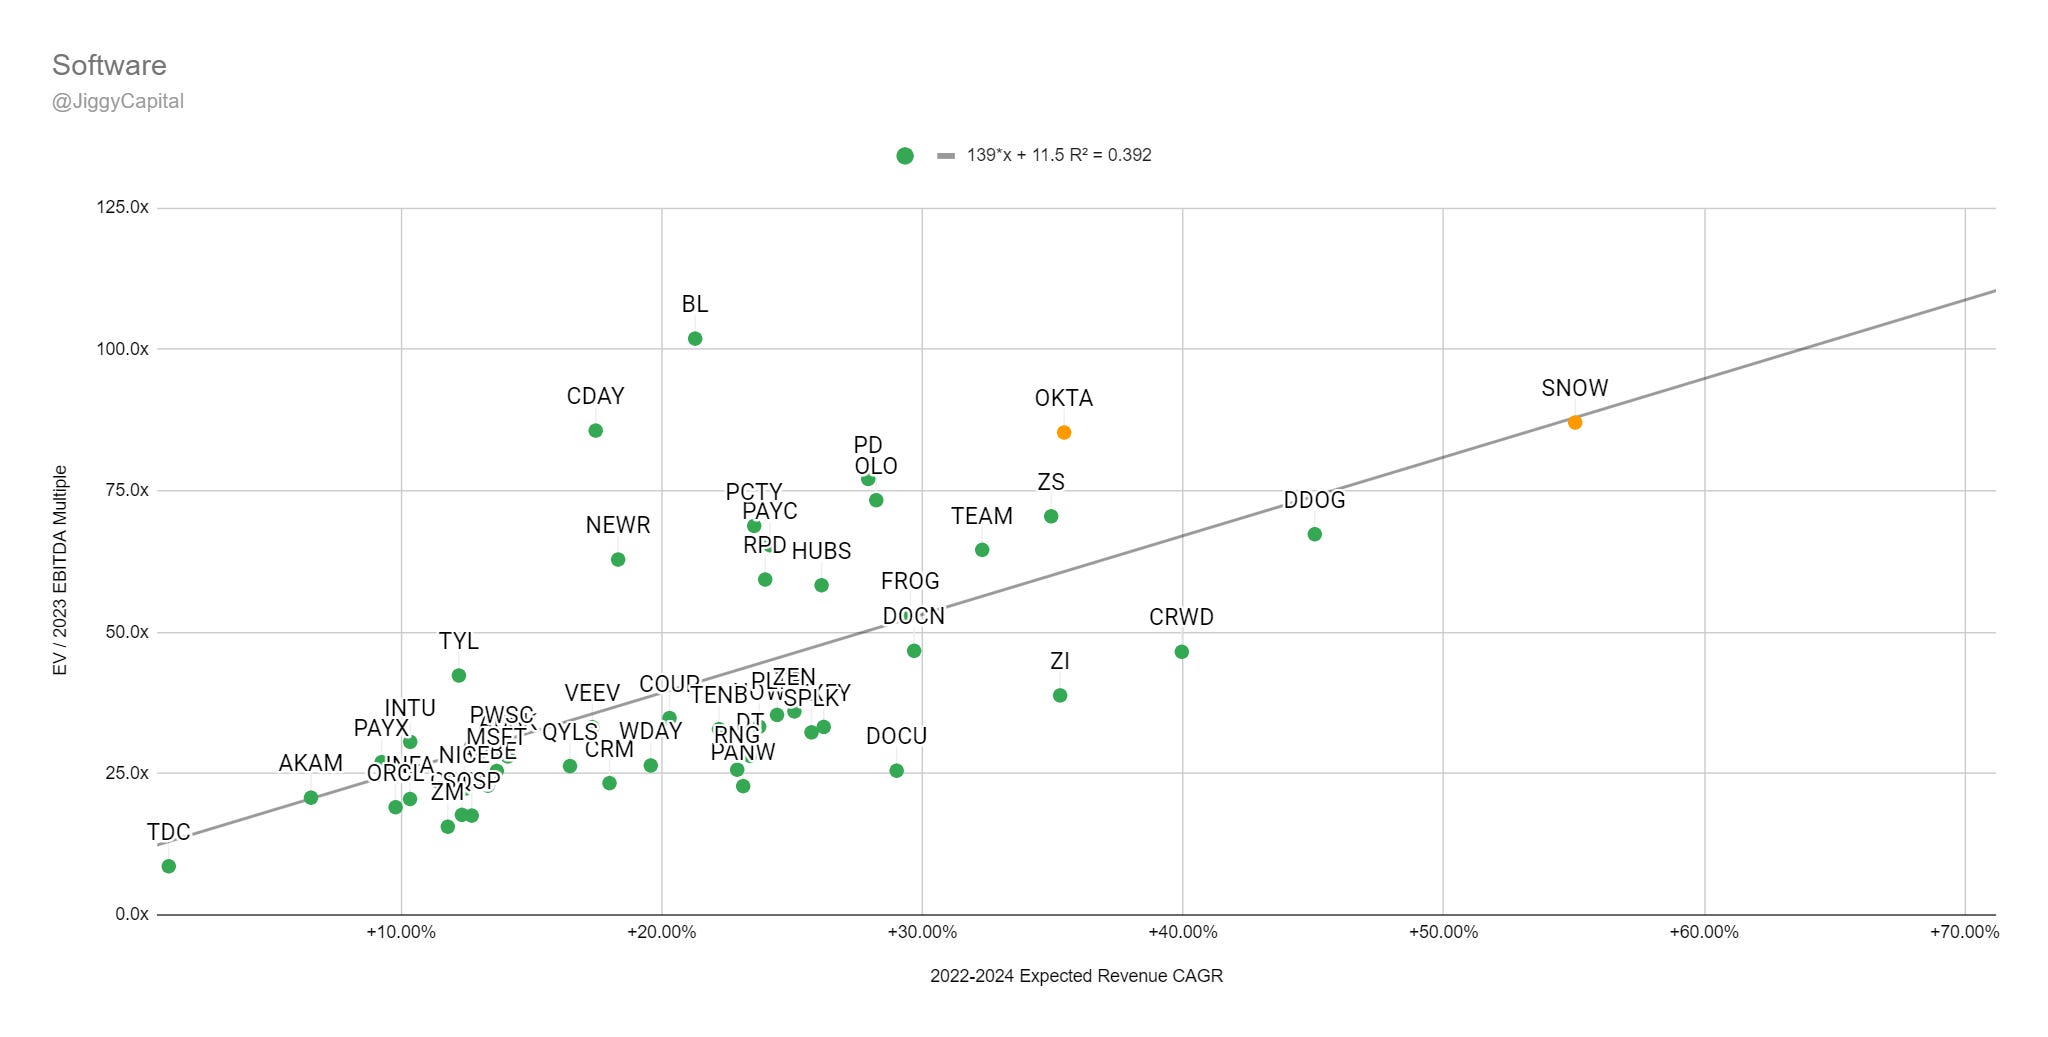
2022-2024 Revenue CAGR vs EV/2023 FCF Multiple:
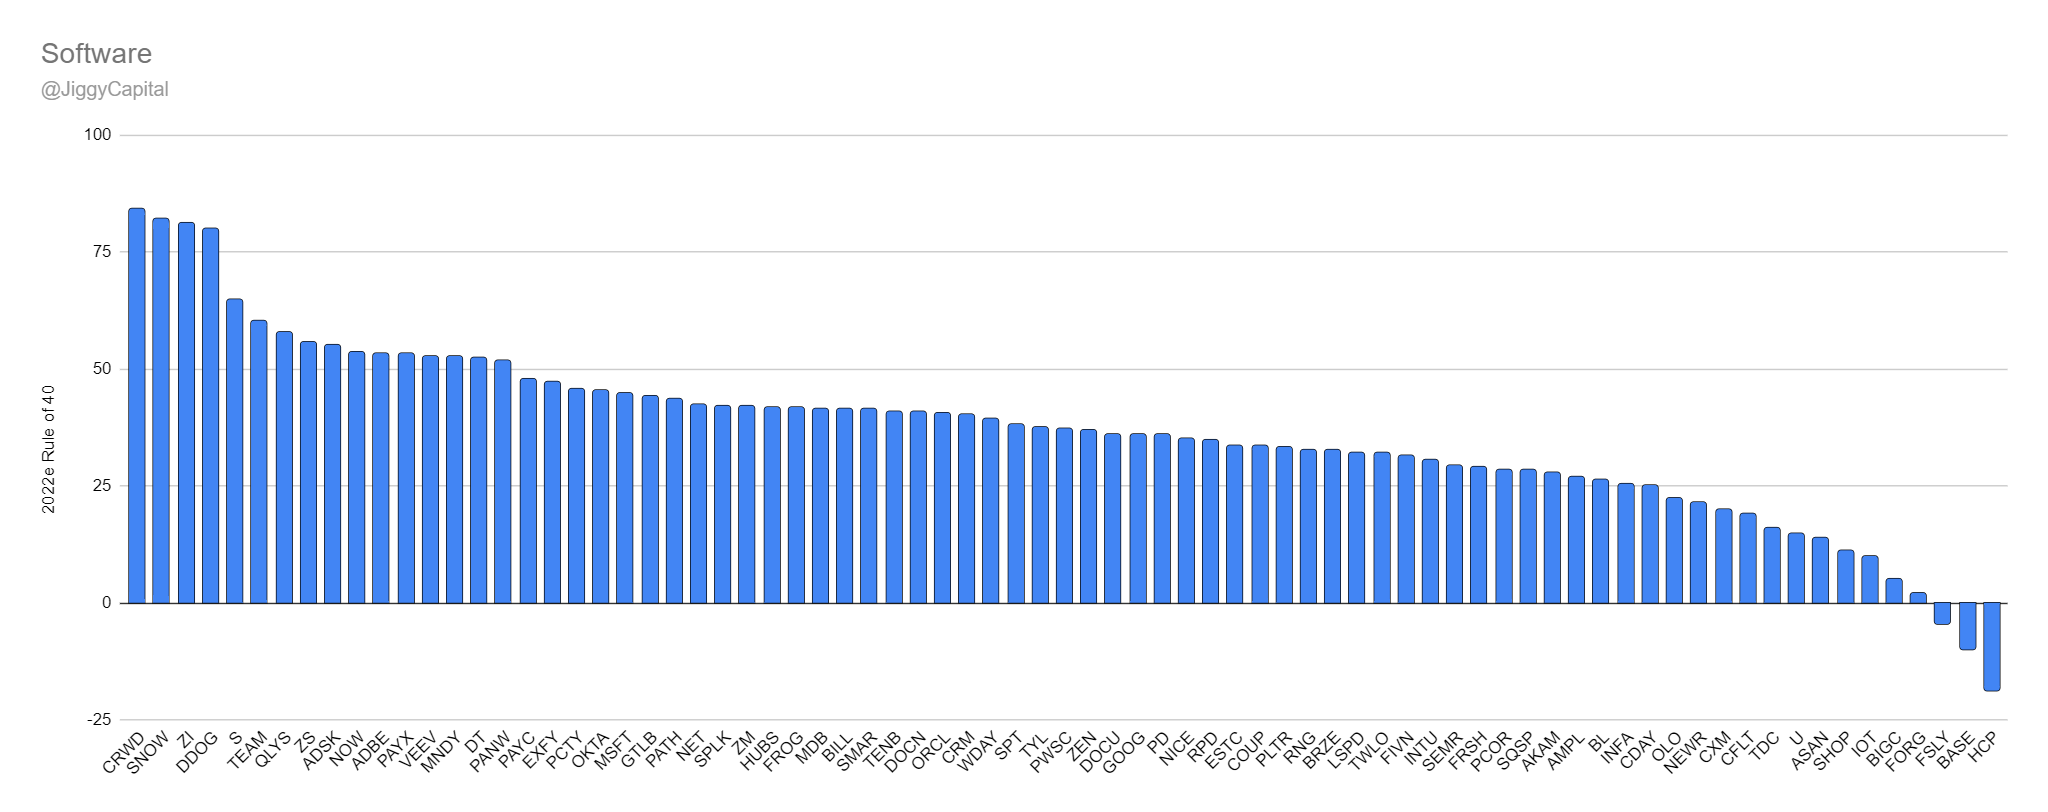
2022e Rule of 40 Scores:
Sector Stats:
Sector Highlights:
Best Gross Margins: Autodesk — 92%
Best 2022e FCF Margins: Microsoft — 49%
Best 2022-2024 Projected Revenue CAGR: SentinelOne — 70%
Best 2022e Rule of 40 Score: Crowdstrike — 83
Best 2022e FCF Yield %: Teradata — 10.7%
Best 2021 SBC as % Gross Profits: Semrush — 2%
Worst Gross Margins: Ceridian HCM — 43%
Worst 2022e FCF Margins: HashiCorp — -65%
Worst 2022-2024 Projected Revenue CAGR: Teradata — 1%
Worst 2022e Rule of 40 Score: HashiCorp — -19
Worst 2022e FCF Yield %: Couchbase — -8.3%
Worst 2021 SBC as % Gross Profits: HashiCorp — 117%
Scatter Plot Trend Line Error Percentage:
“Undervalued”:
Gross Profit: RingCentral (209% Upside)
EBITDA: Palo Alto Networks (98% Upside)
“Overvalued”:
Gross Profit: Nice (-69% Downside)
EBITDA: Nice (-60% Downside)
Full Data:
Gross Profit:
FCF:
My Take: Much of the takeaways from the broken out software groups hold true for this as well, where RingCentral and Palo Alto Networks both stand out the most to me. In the more growth land, my scatter plot exercise would lead that Crowdstrike and ZoomInfo are also pretty attractive.
Conclusion
I hope this was an enjoyable read and provided that extra inspiration to start digging on a company you’ve been curious about.
In the future I hope to be adding more and more data/value to each of these editions! I included the statistics on SBC in this edition and still think there’s a bit more valuable information I can include but just want to be mindful on the lengthy read.
Here are my personal top standouts from each sector:
Application Software: RingCentral
Financial Services: Shift4 Payments
Industrials: Advanced Auto Parts
Infrastructure Software: Palo Alto Networks
Internet: Meta Platforms
Semiconductor: Micron
Software: Squarespace
Like I said in the beginning of the post, I hope to now be back in the swing of things posting newsletters every two weeks once again! As I’ve mentioned before this year, I started a new job back in April in Sales at a public SaaS company which has been quite the adjustment, but to this point has been one of the best decisions of my life honestly :)
I now feel like I have acclimated to the new lifestyle and have carved out a schedule to prioritize my newsletter, because I honestly really enjoy doing this! The rest of Q3 2022 newsletter schedule is as follows:
September 4th — Earnings Recap
September 18th — Forward Model
September 25th — LinkedIn Hiring Insights (Bonus)
October 2nd — My Portfolio
- Sean
Hi Sean,
Always enjoy reading your blogs. Thanks a lot for doing this.
Just curious, do you use script to pull the historical/projected financials? Is there anyway I can find it on opensource?