

Click here to view this post in webpage form
After stumbling upon realizing how cool of a feature LinkedIn Premium is for investing purposes (I have it for my job), and of course making sure I could share this information in their user policy (if anything I’m promoting this service for LinkedIn in a whole different way they intended haha), I posted on twitter what started as sharing the insights of my 13 personal holdings from the service which include:
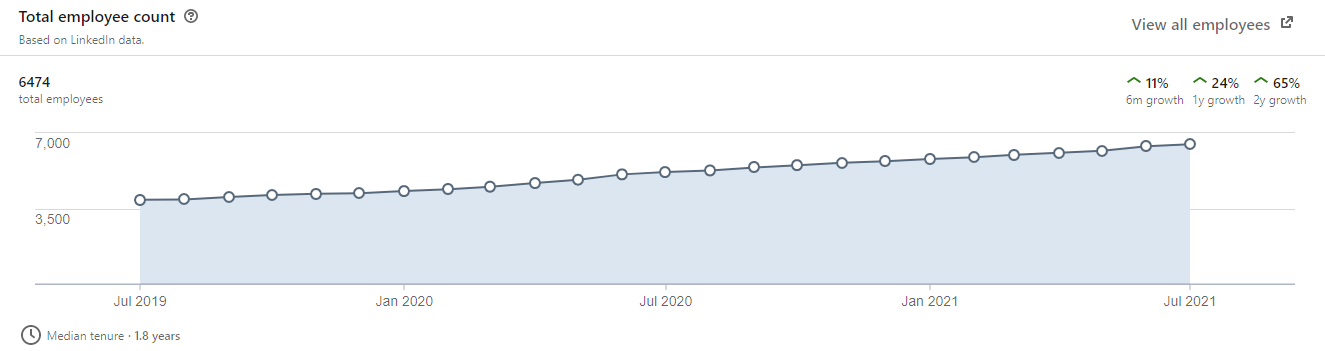
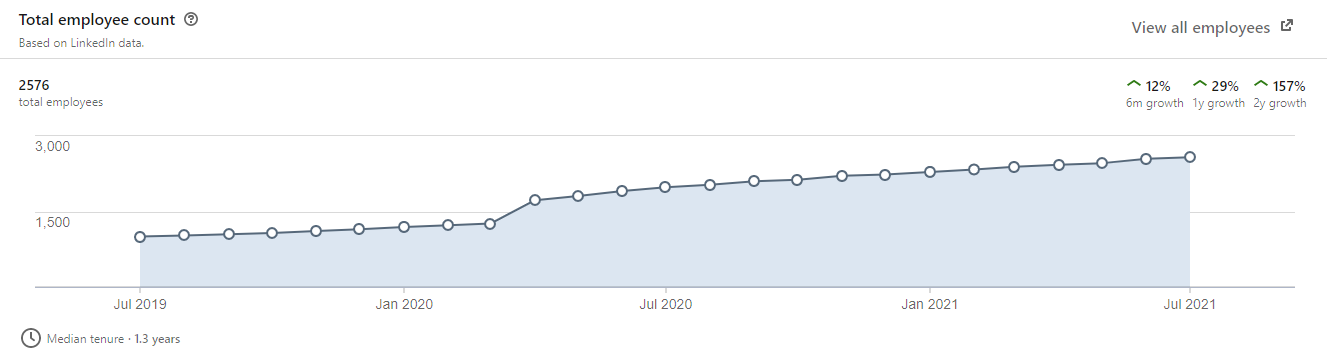
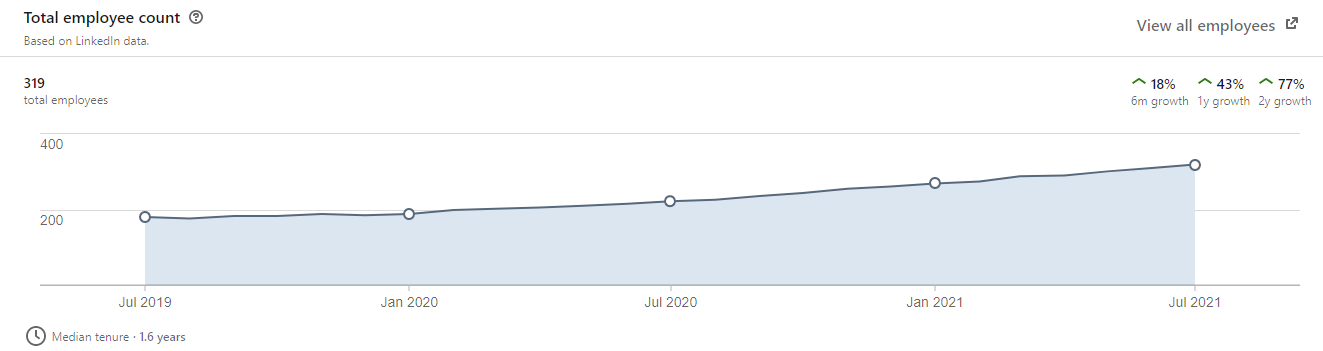
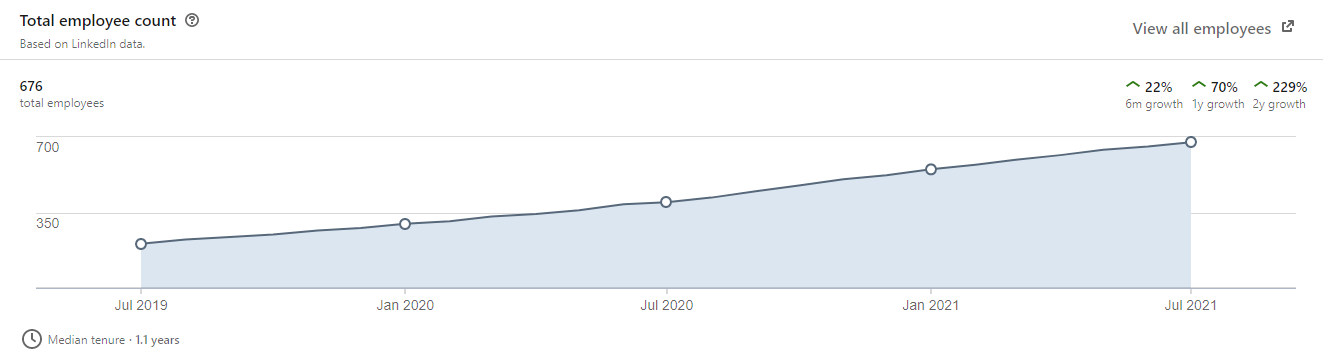
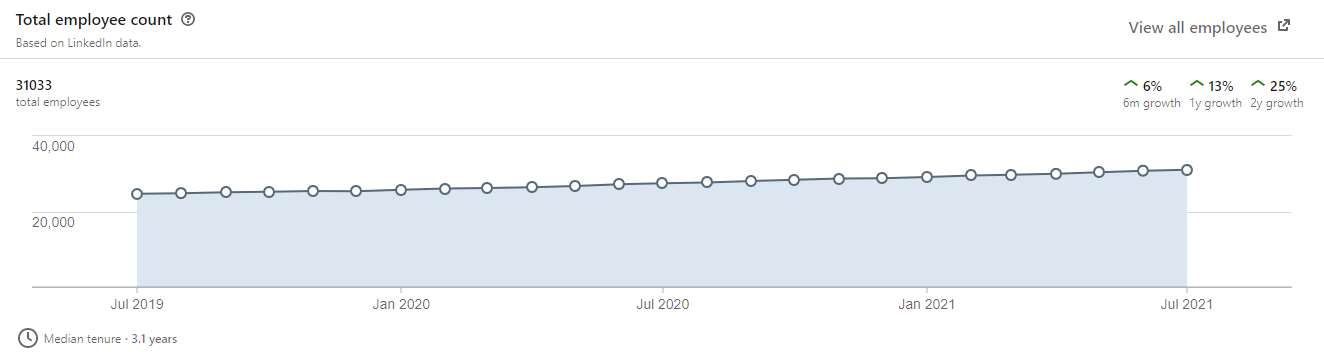
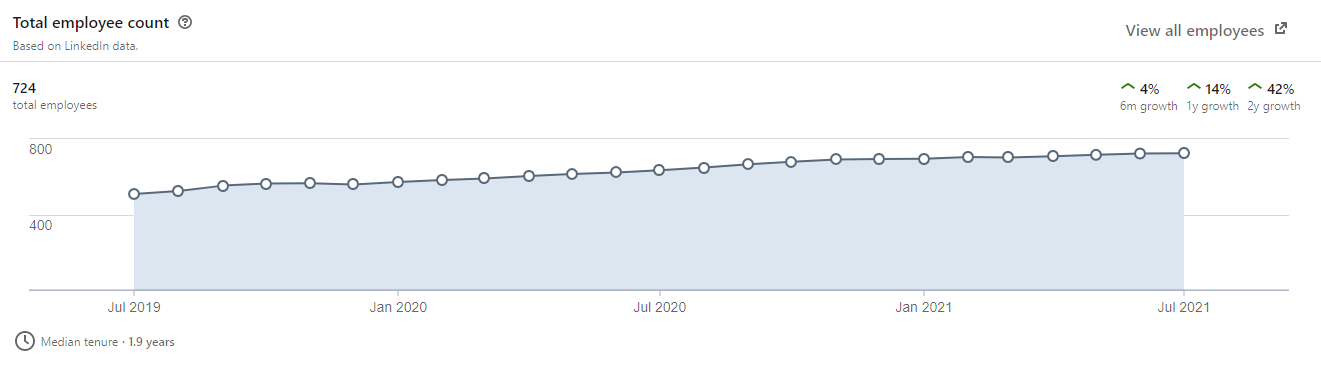
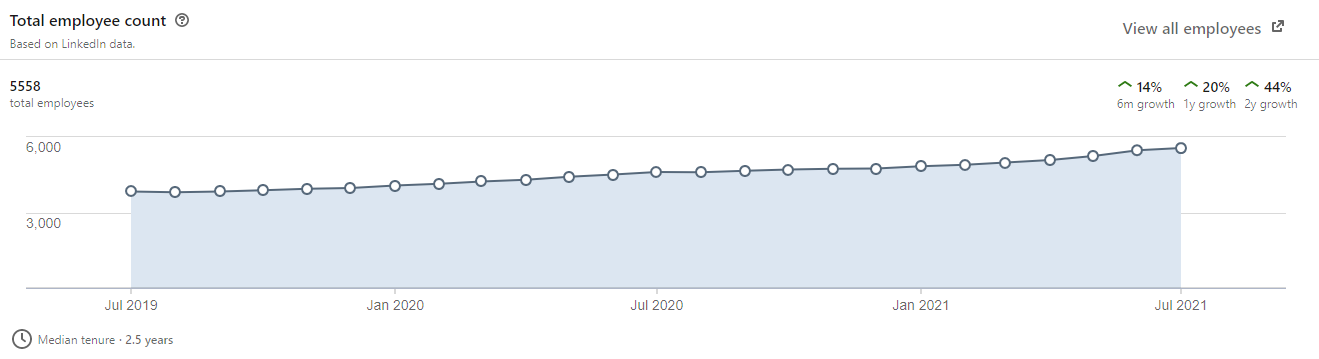
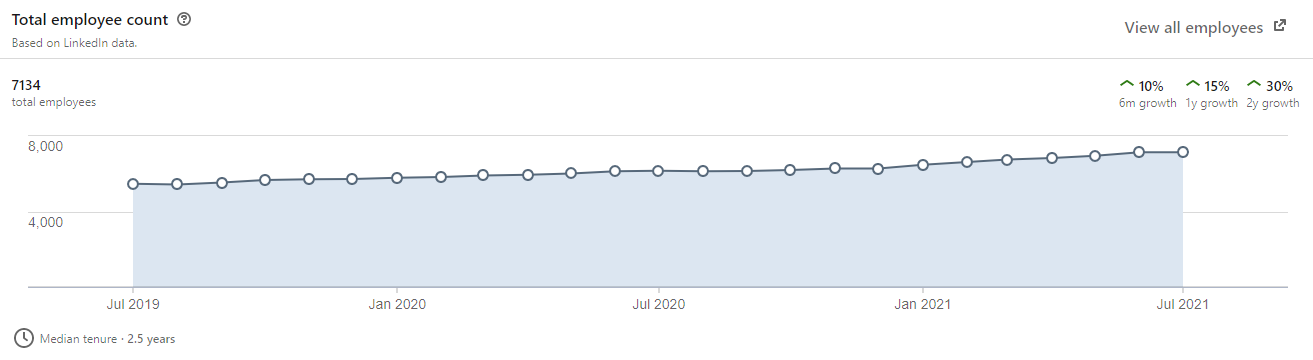
Total Headcount
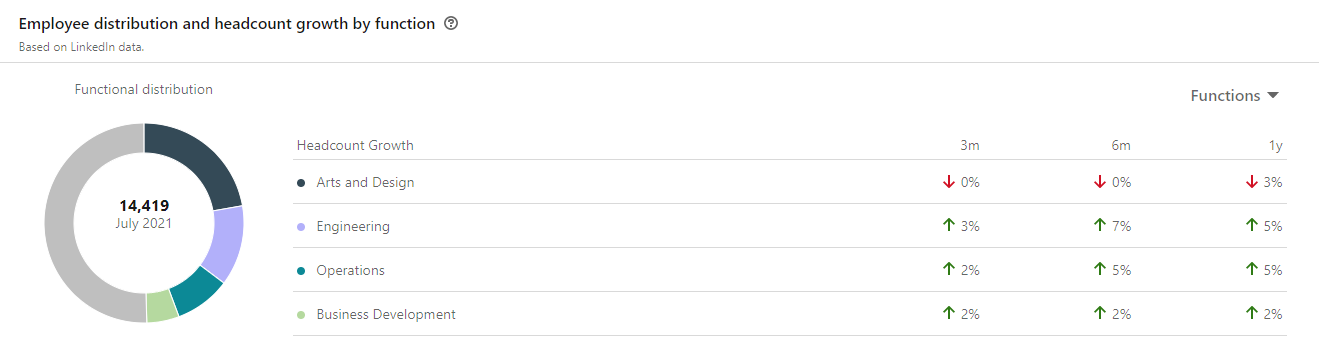
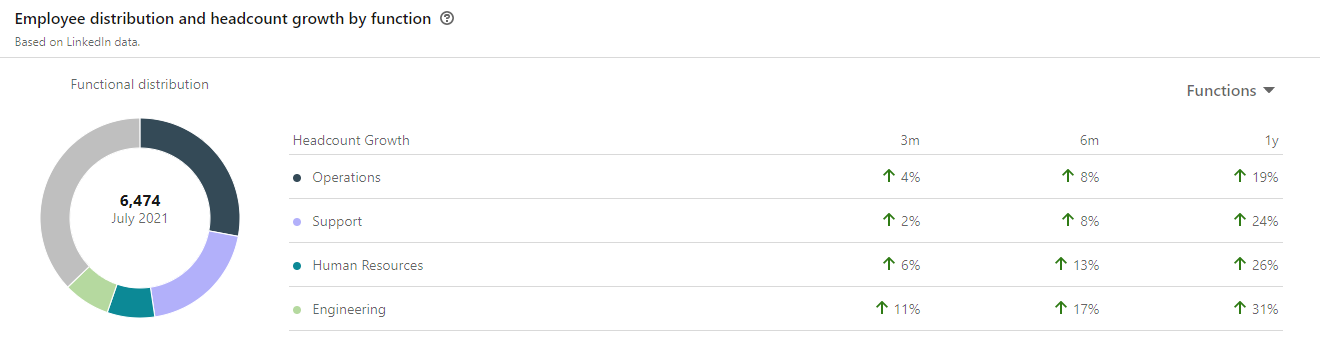
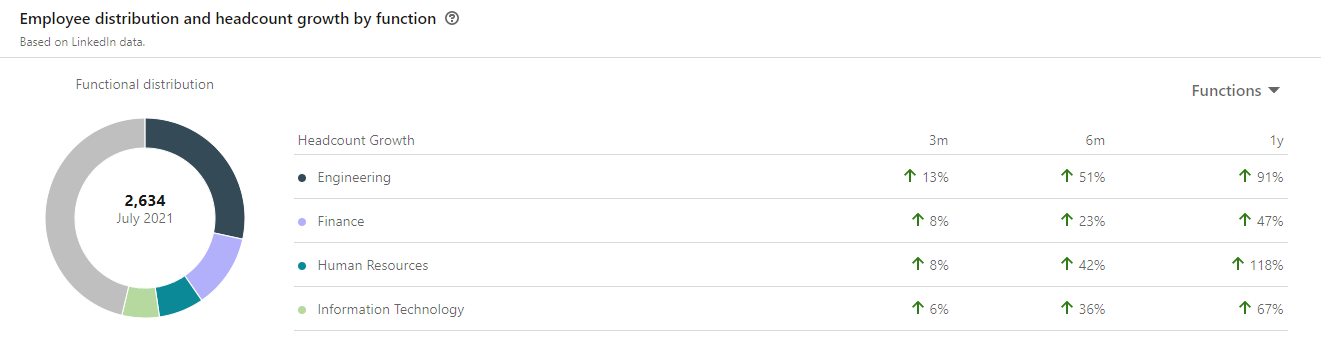
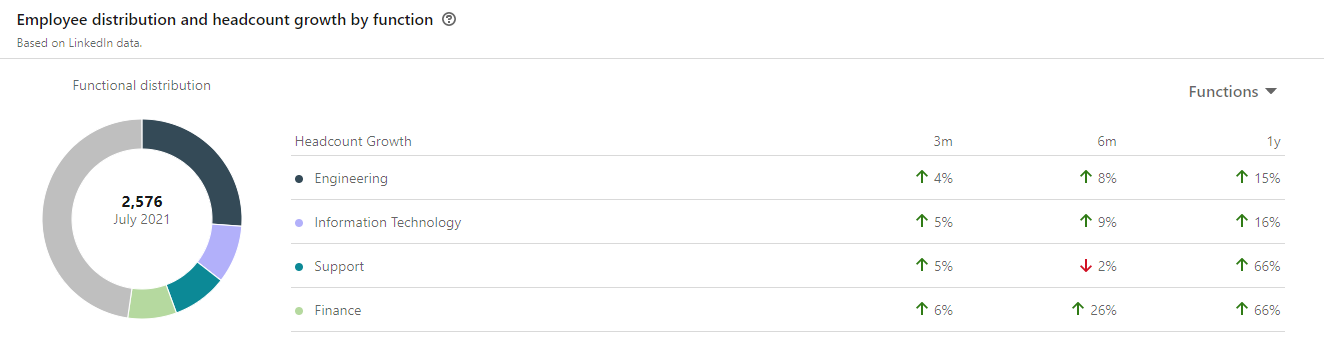
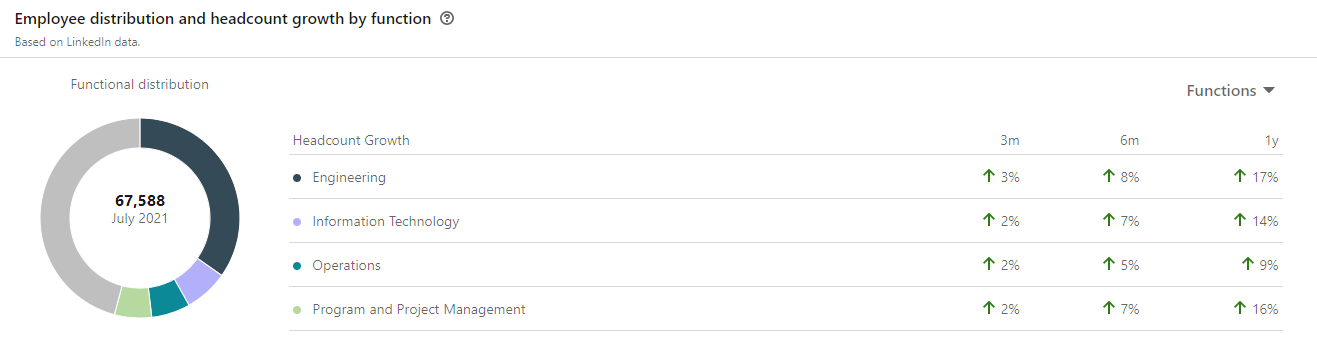
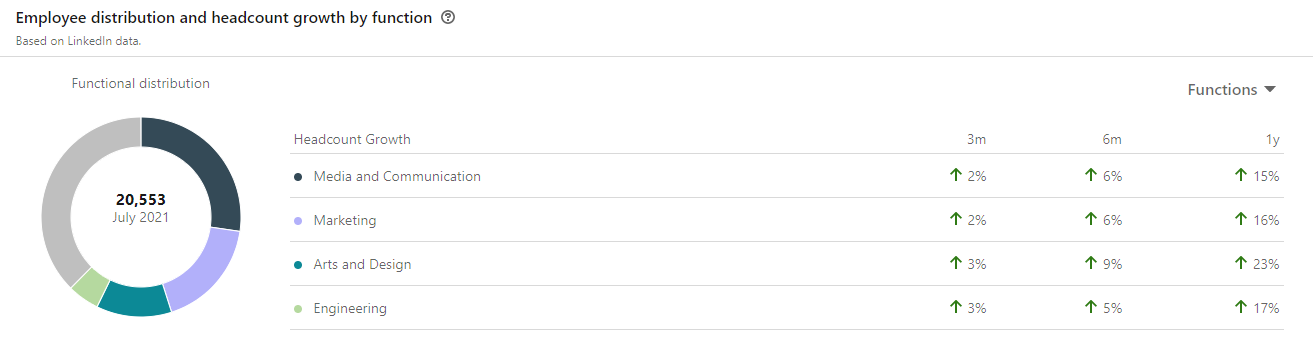
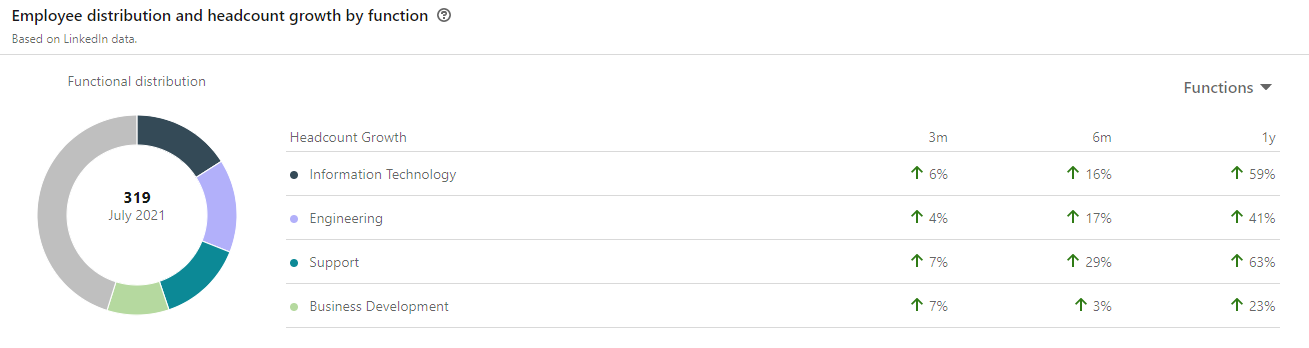
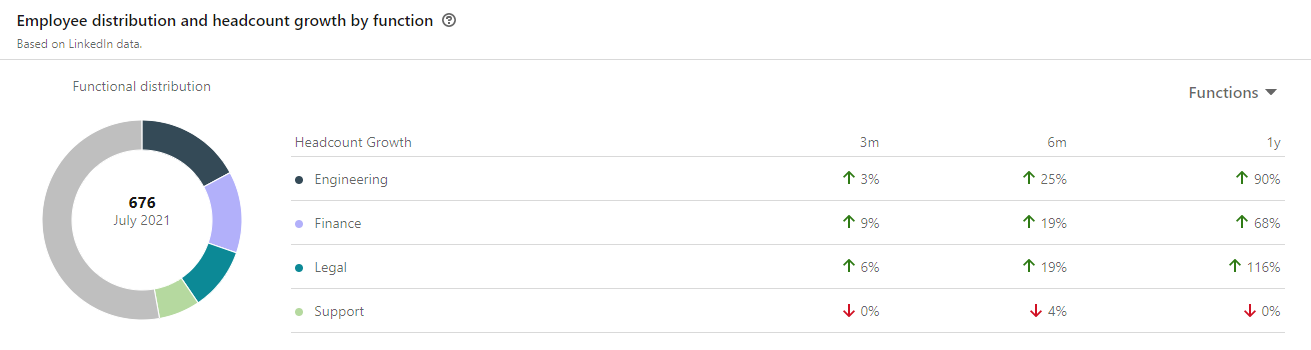
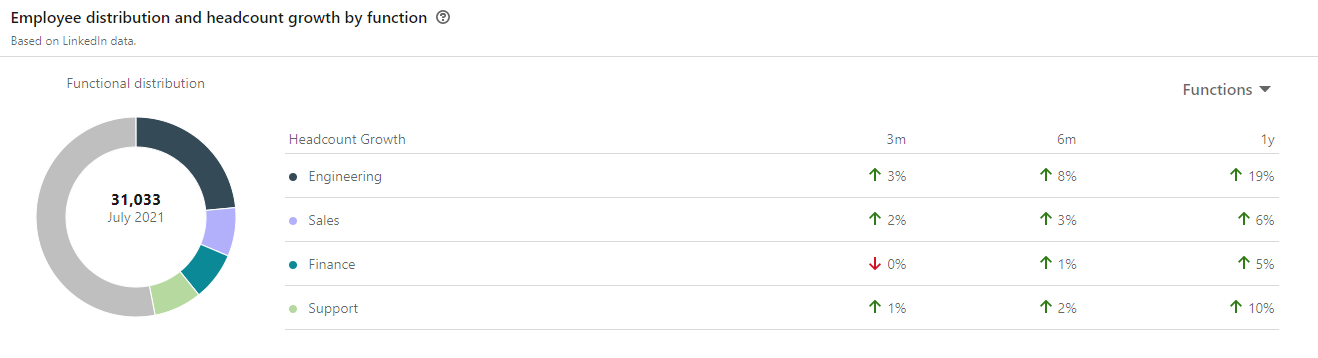
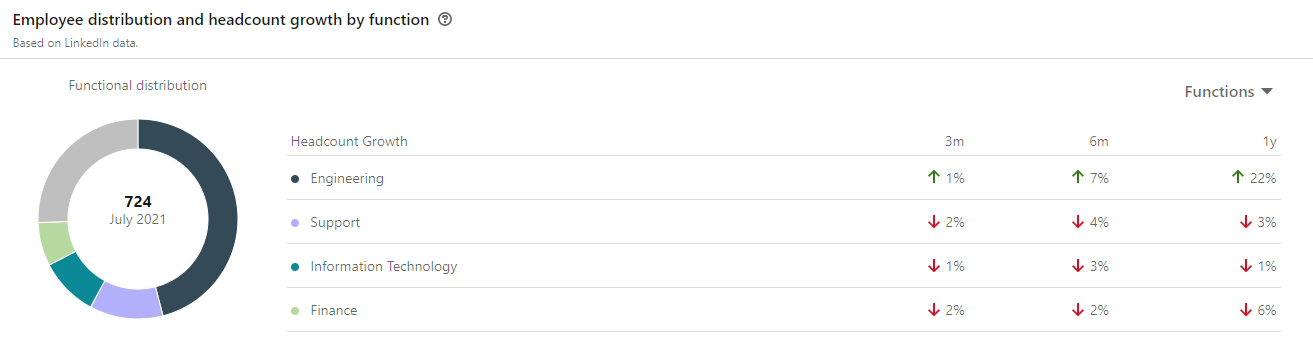
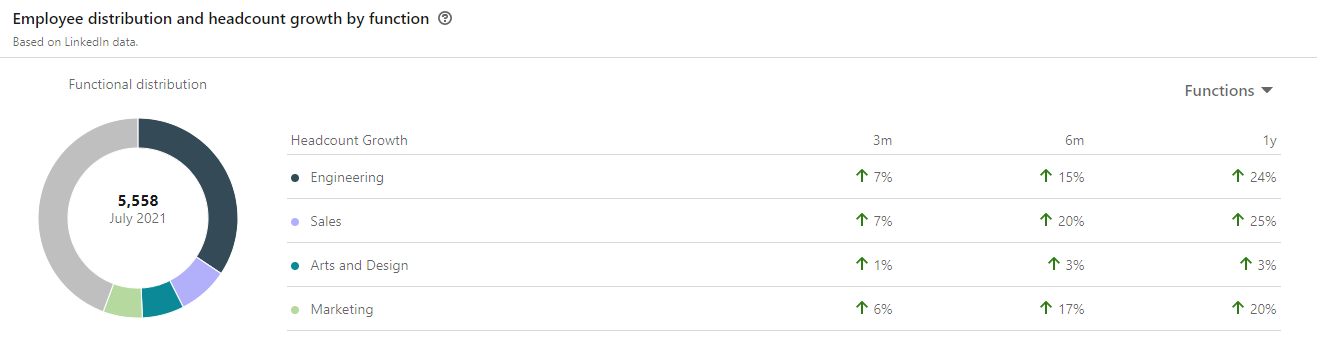
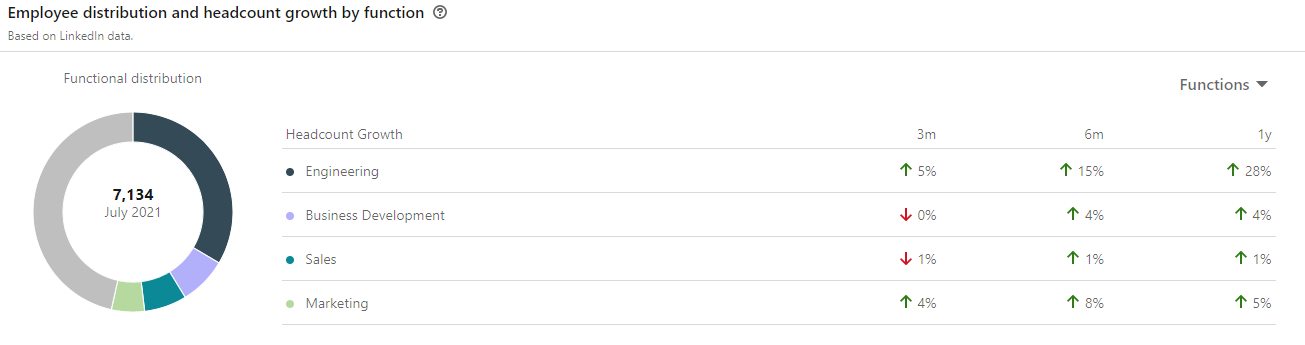
Headcount by Department Insights
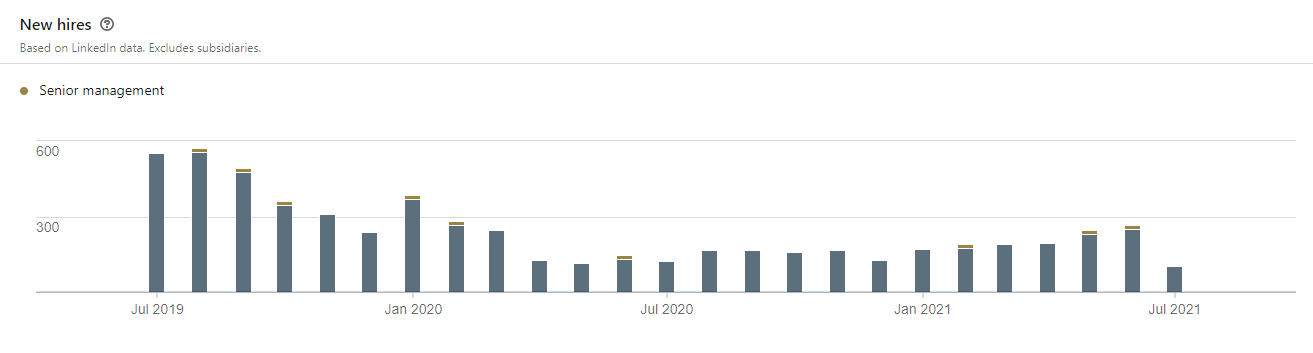
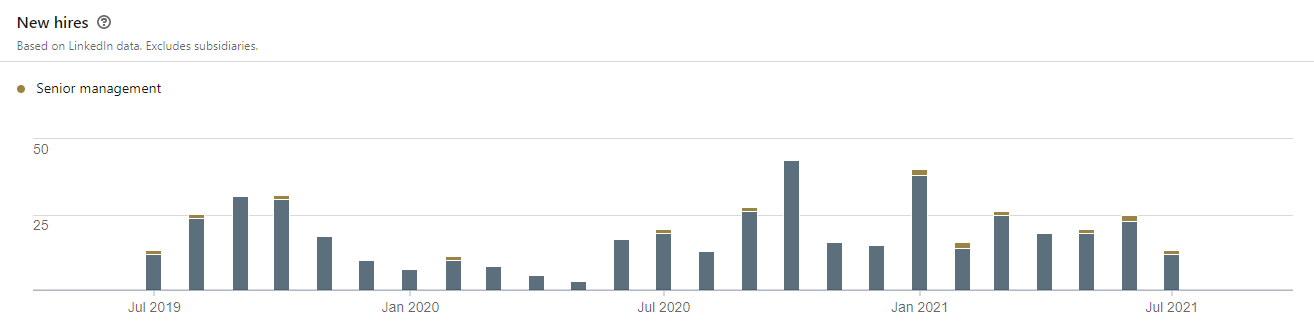
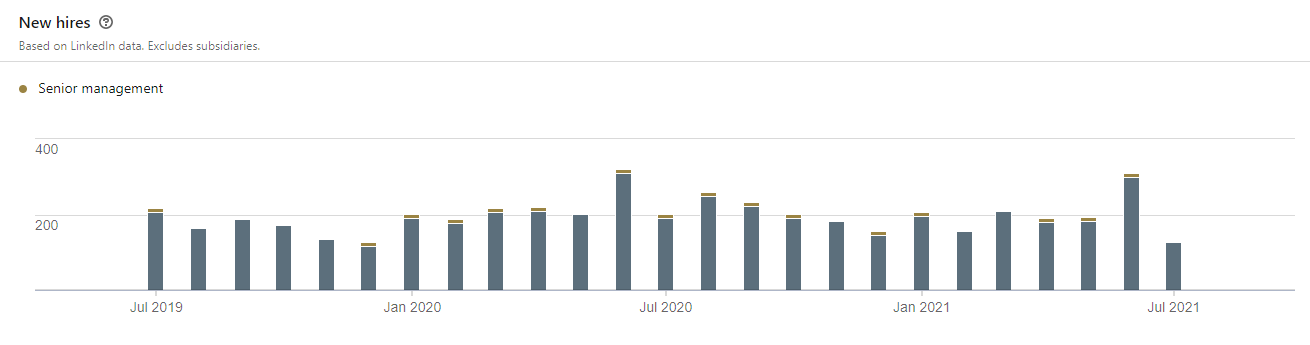
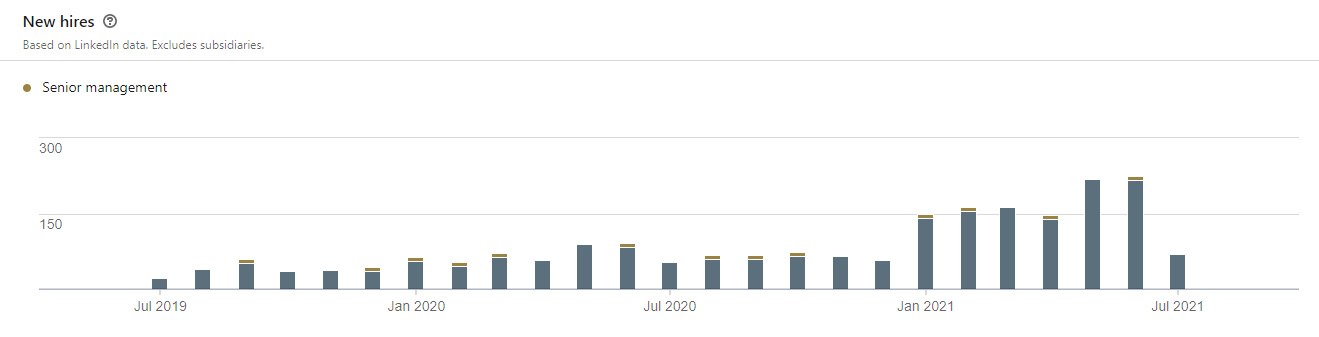
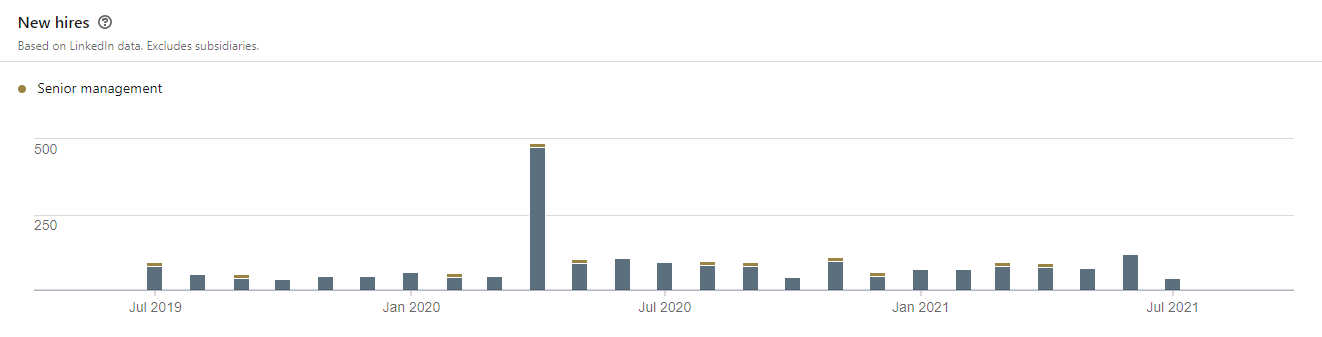
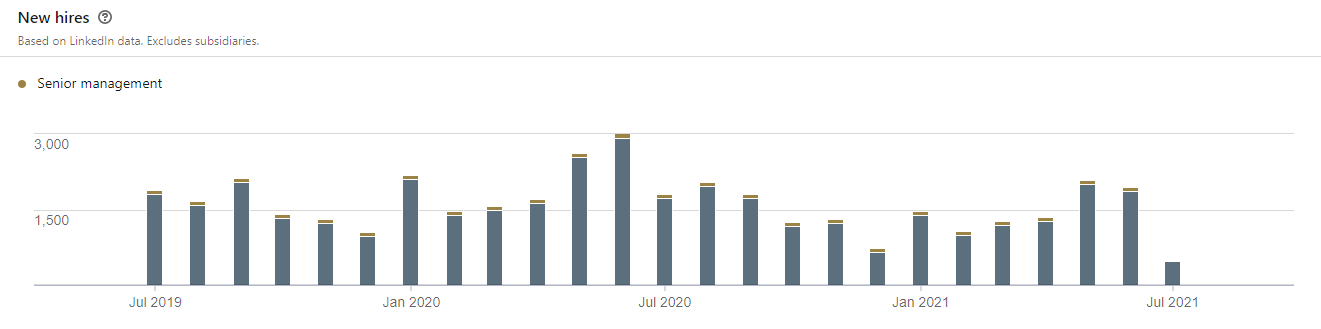
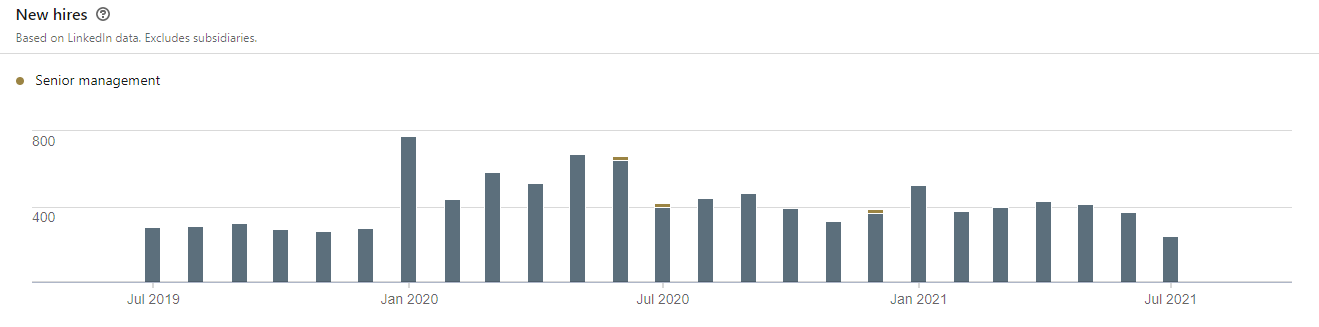
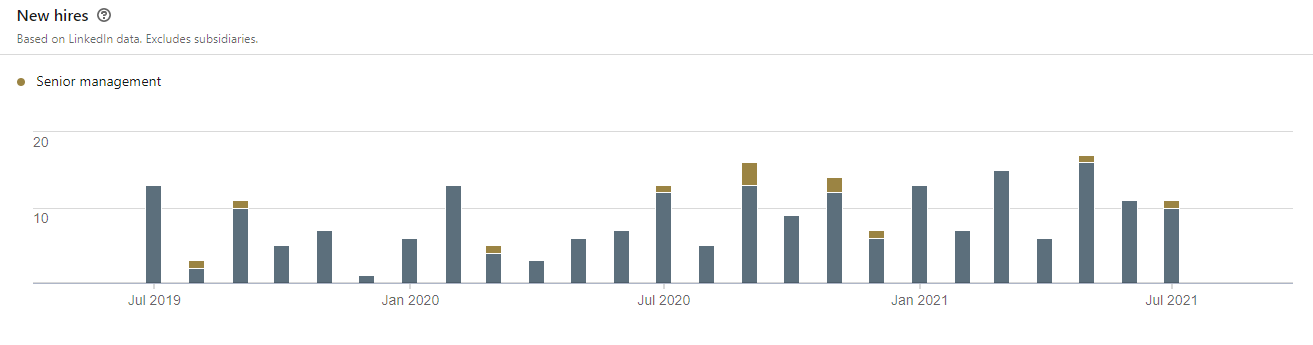
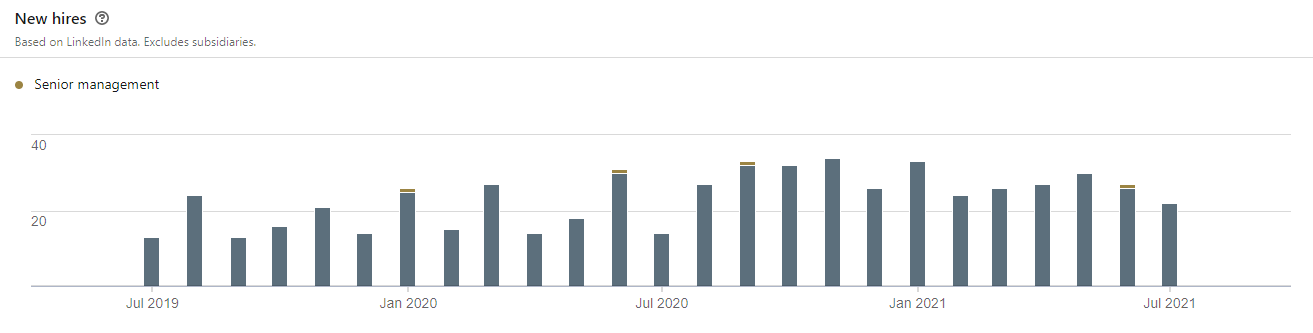
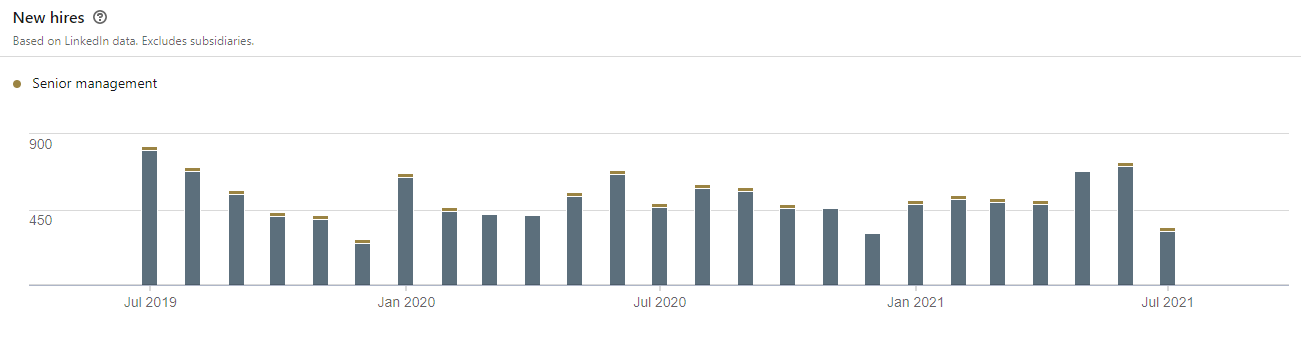
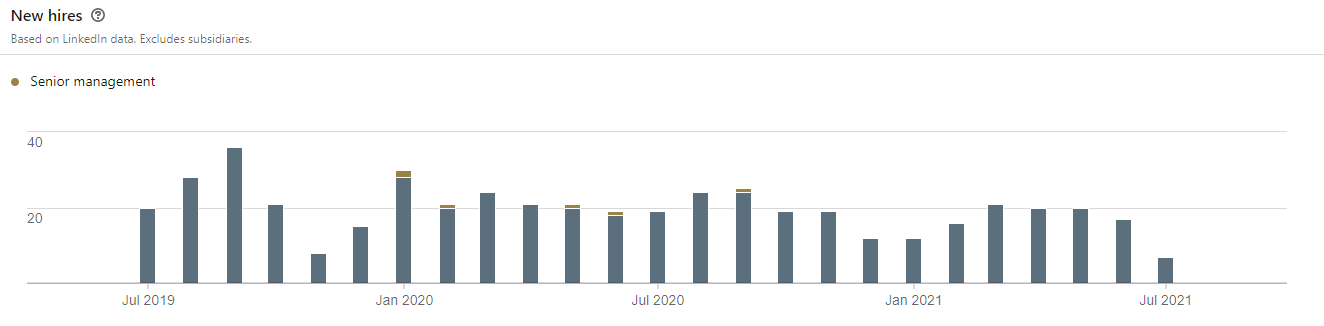
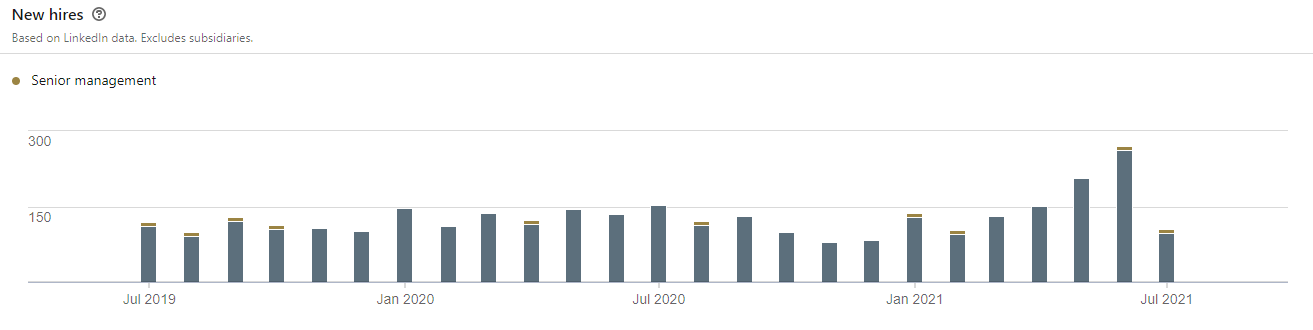
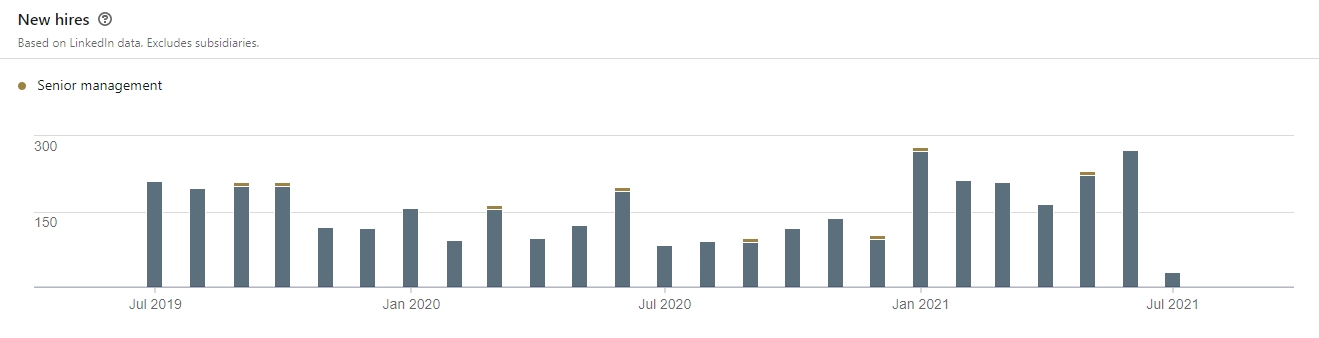
New Hires By Month
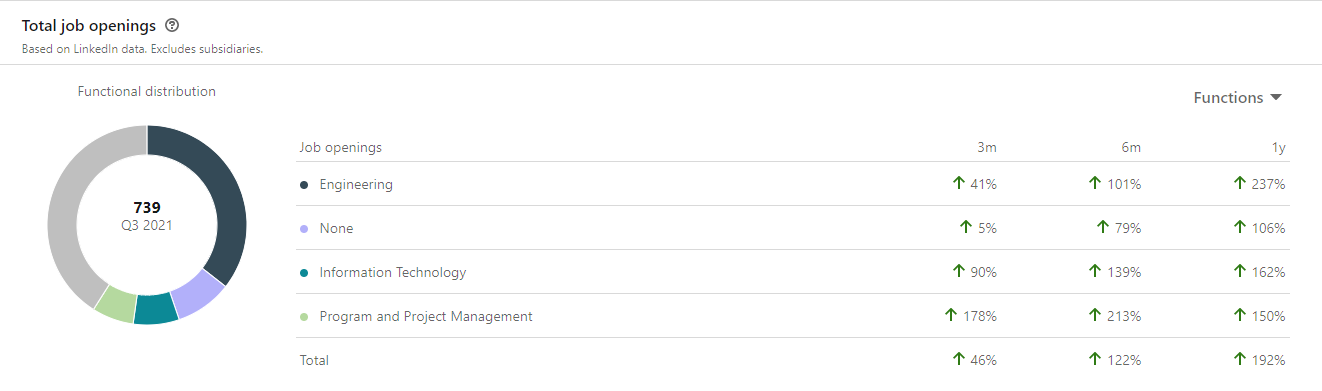
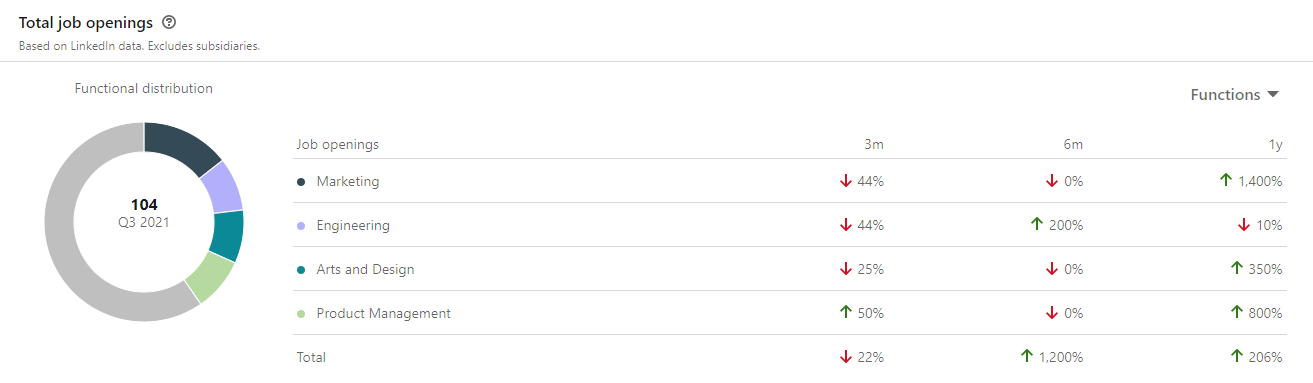
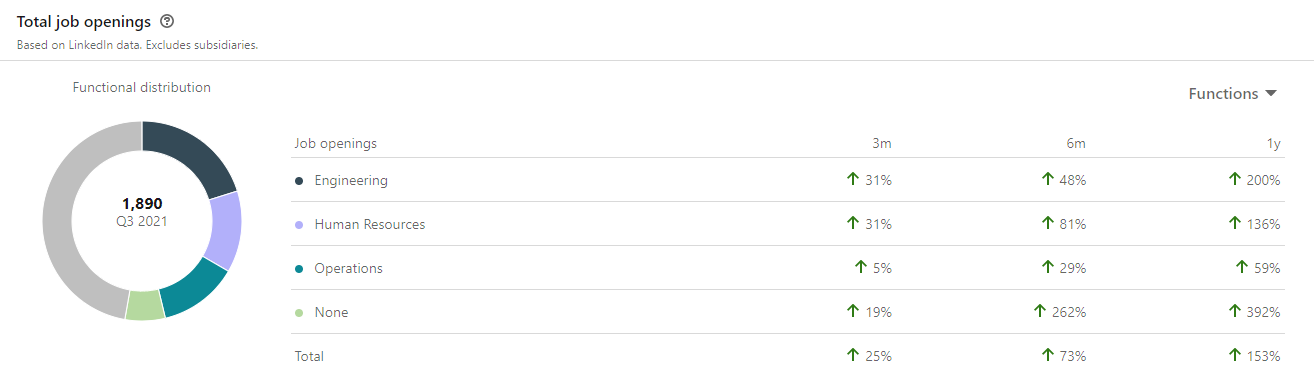
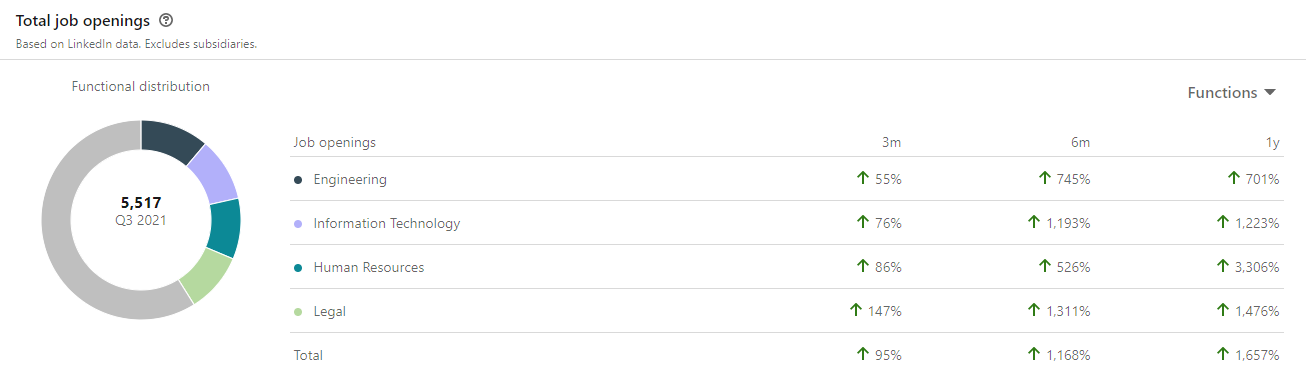
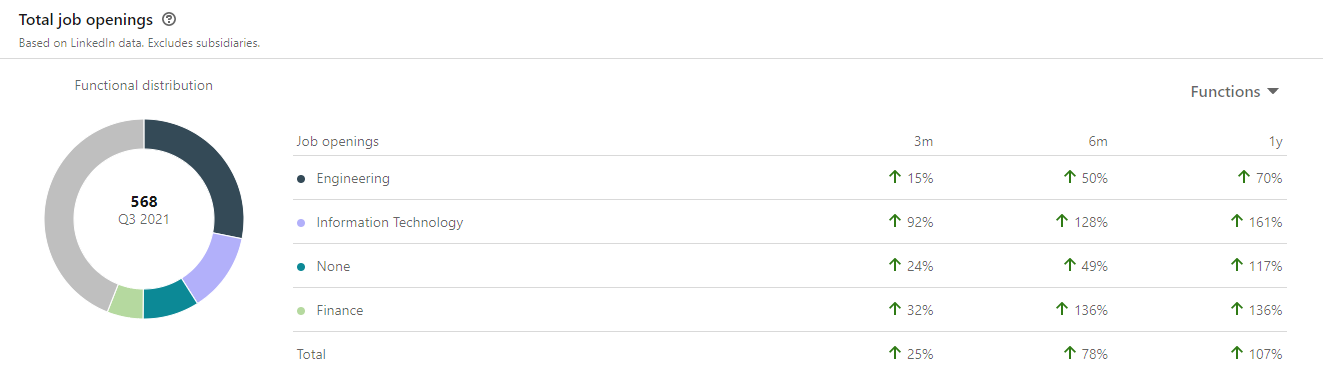
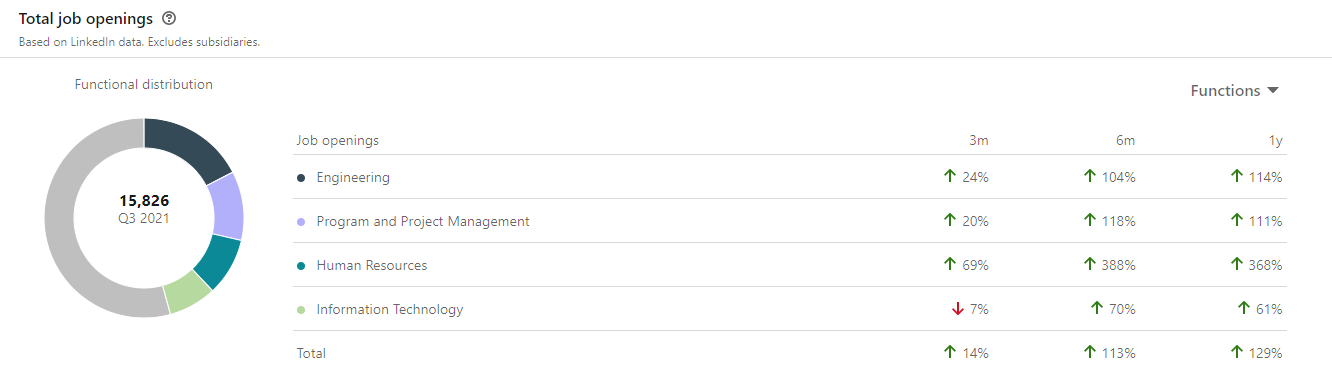
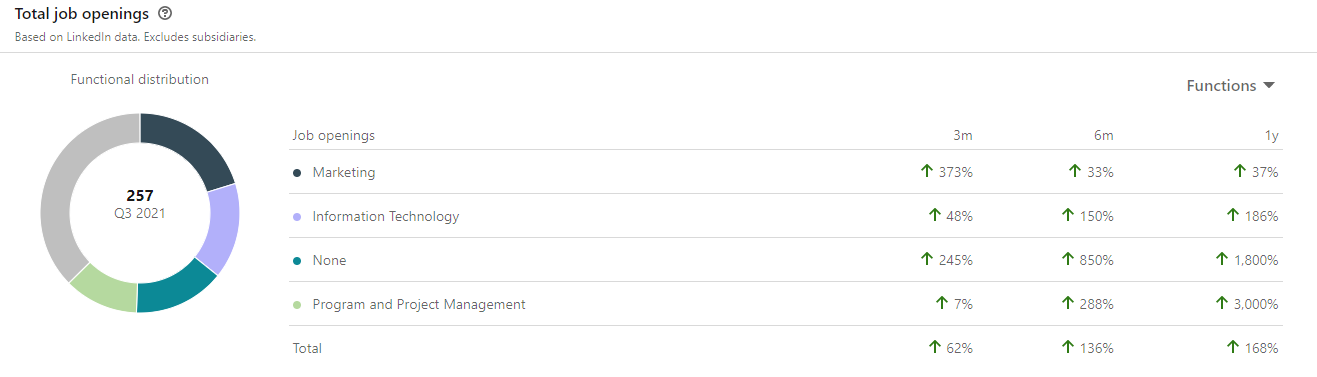
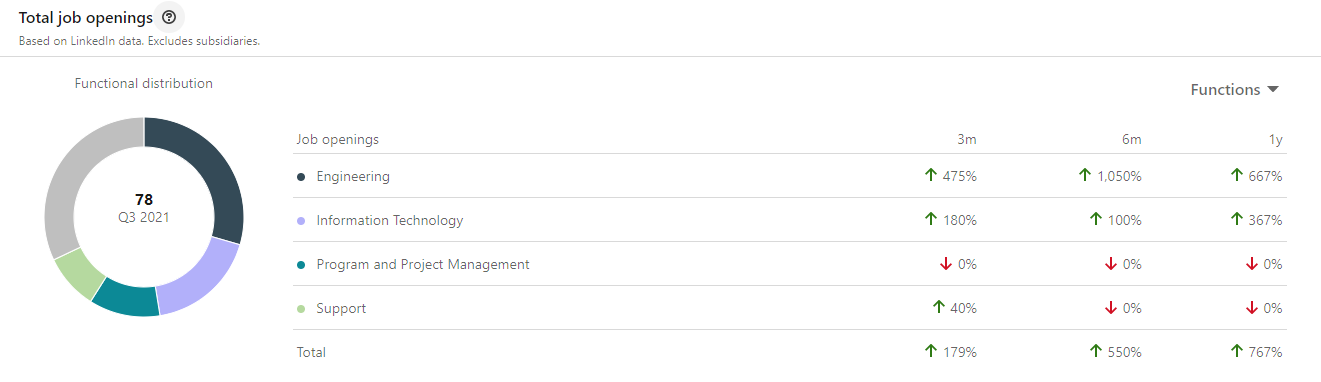
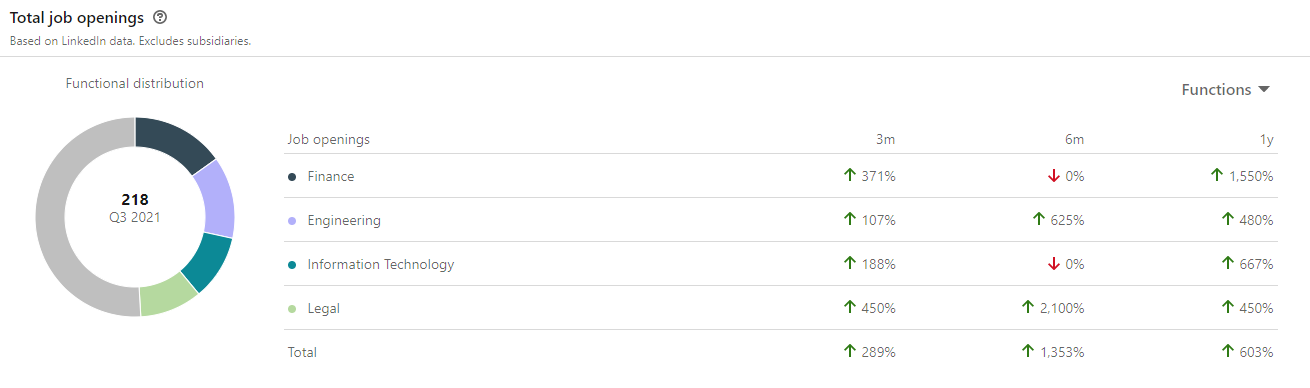
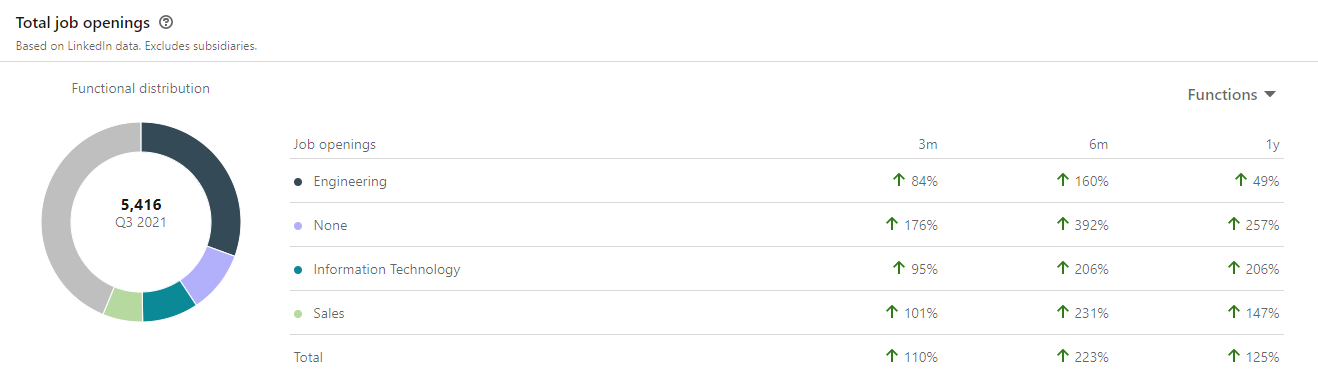
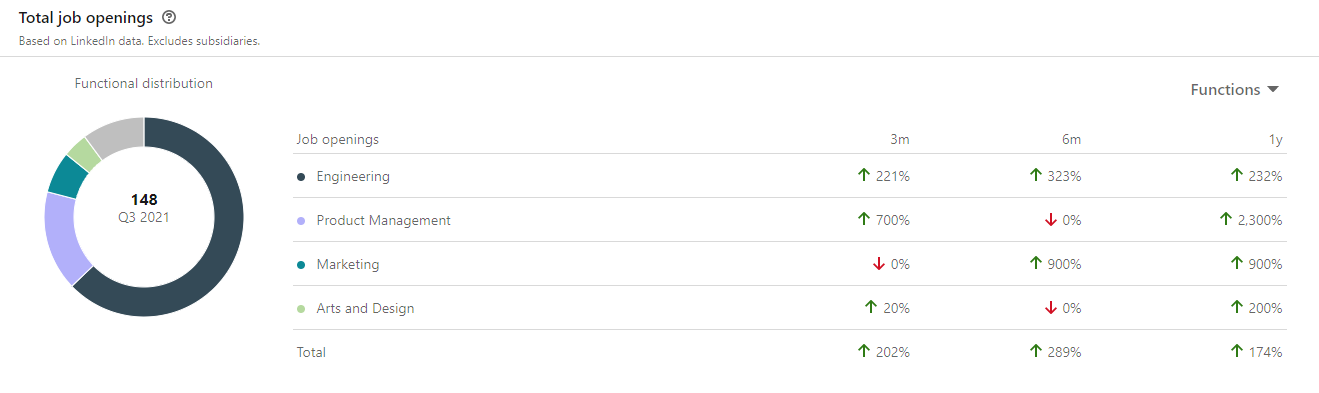
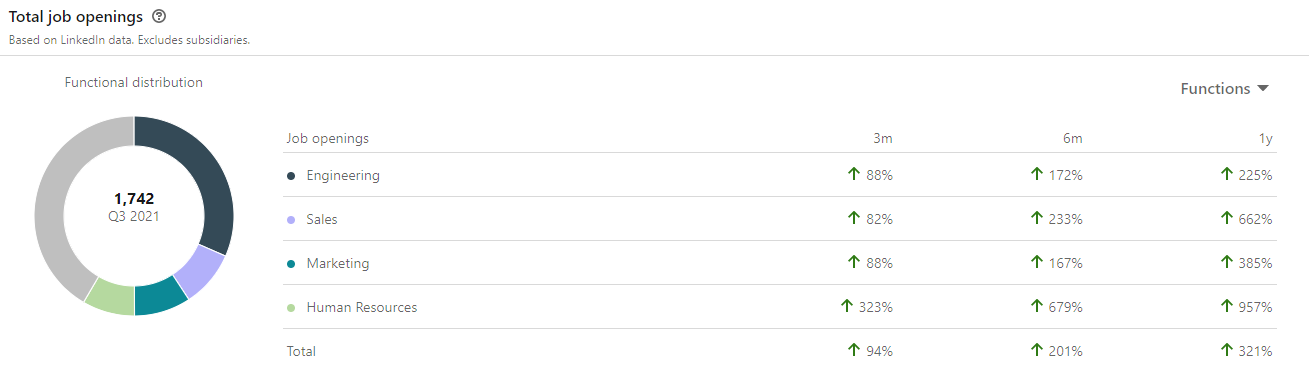
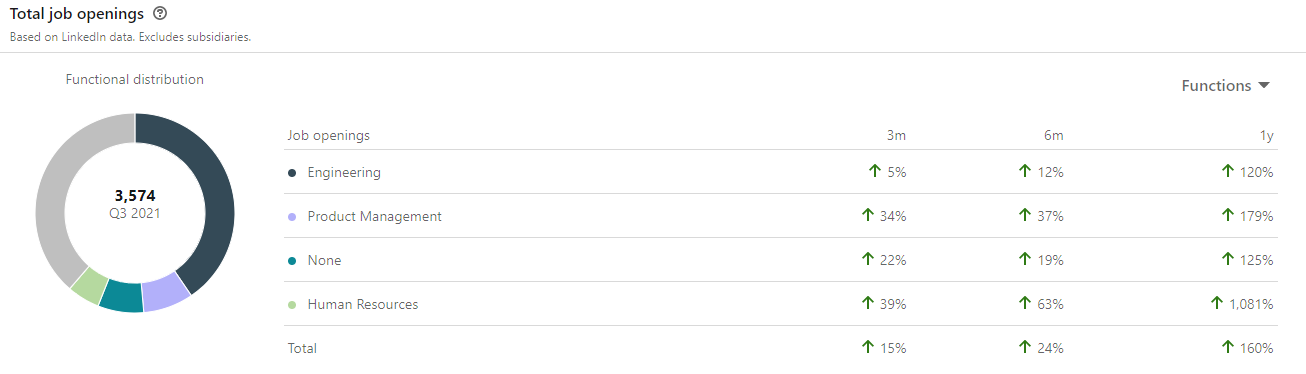
Job Openings Insights
Well, that blossomed into a 40+ tweet thread and scattered replies to requested ones highlighting a total of 36 parent companies (best part is I can search subsidiaries like Shopee, Galileo, Cash App, Oculus VR etc) so I decided I’d piece together that thread into a much easier way to consume.
I’ve added more parent companies as well to round out into a nice 50 :) It’s worth mentioning this is only as good as the data LinkedIn has. Stick around for the highlights at the end! Now let’s get right into it by alphabetical order:
AirBnB
Ticker: ABNB
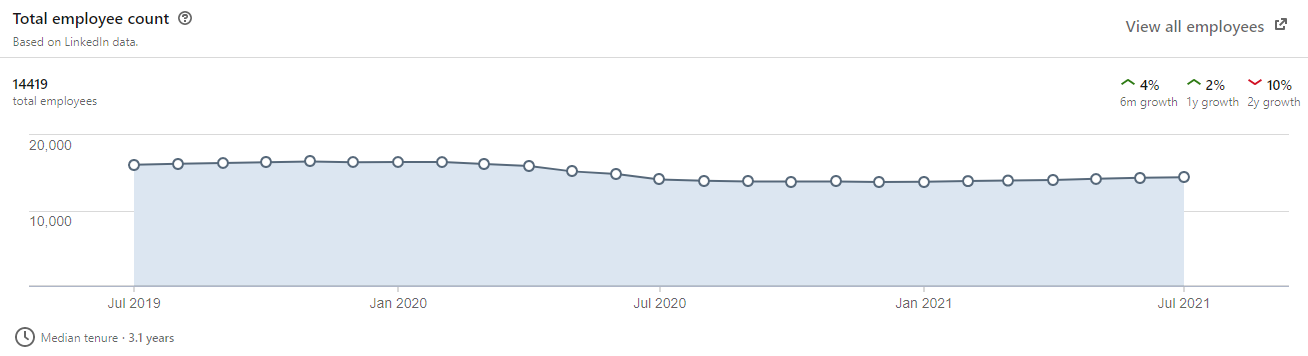
4% six month total headcount growth
Flat hiring over the last year with a slight increase over the last two months. Pre-pandemic hiring was much stronger peaking in August 2019
Over a third of the total job listings are engineering related with an increase of 41% over the last three months
Median tenure 3.1 years
BarkBox
Ticker: BARK
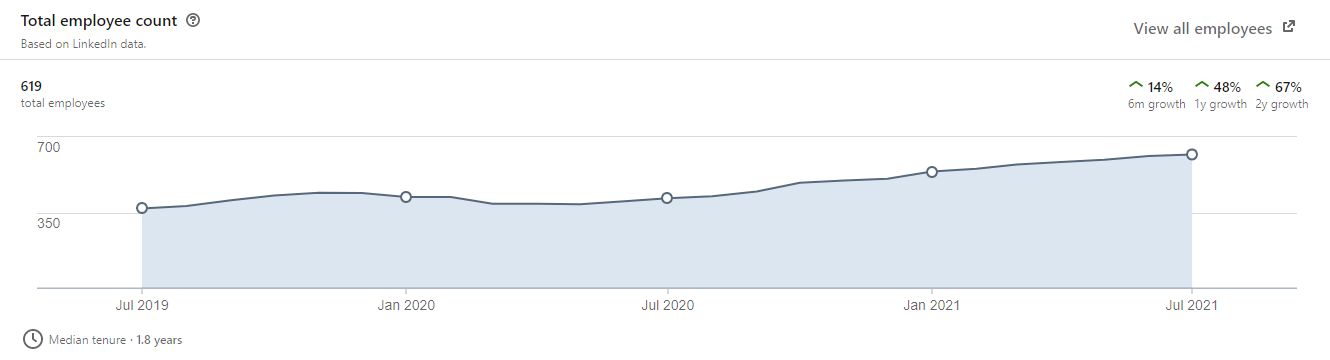
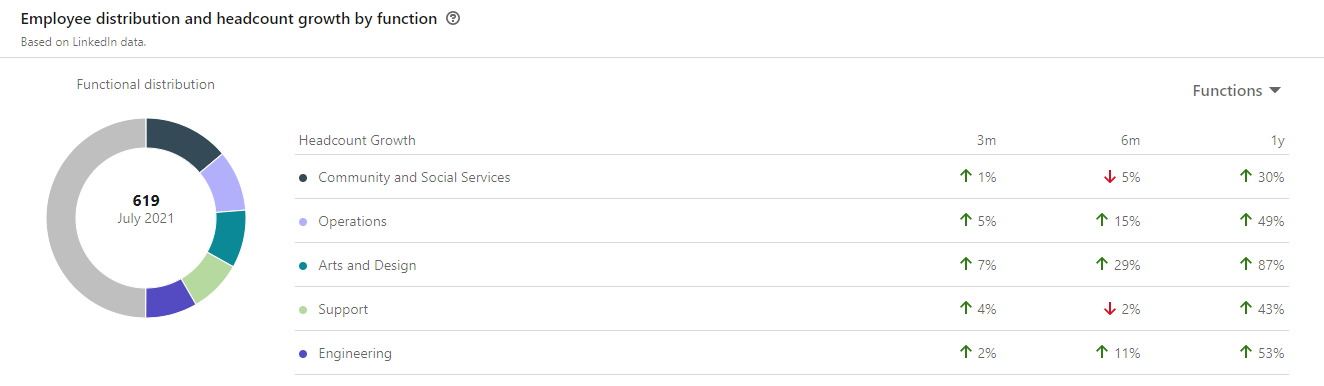
14% six month total headcount growth
More consistent levels of hiring over the last year with strongest hiring month Oct ‘20 and Jan ‘21
Total job listings decreased by 22% over the last three months - hiring outside LinkedIn?
Median tenure 1.8 years
Callaway
Ticker: ELY
Callaway


5% six month total headcount increase
Steady rate of hires over the last two years
IT & Engineering job openings up 218% and 60% over last six months
Median tenure 6.1 years
TopGolf


3% six month total headcount increase
Before COVID looks like they were really ramping up hiring people on the hiring distribution chart
Triple digit growth in job listings over last 3 months across the board
Median tenure 2.8 years
Chewy
Ticker: CHWY
11% six month total headcount increase
11% increase in engineering department headcount over last three months
Steady hiring by month with strongest month in June the last two years
31% engineering job listings increase over last three months
Median 1.8 years
Coinbase
Ticker: COIN
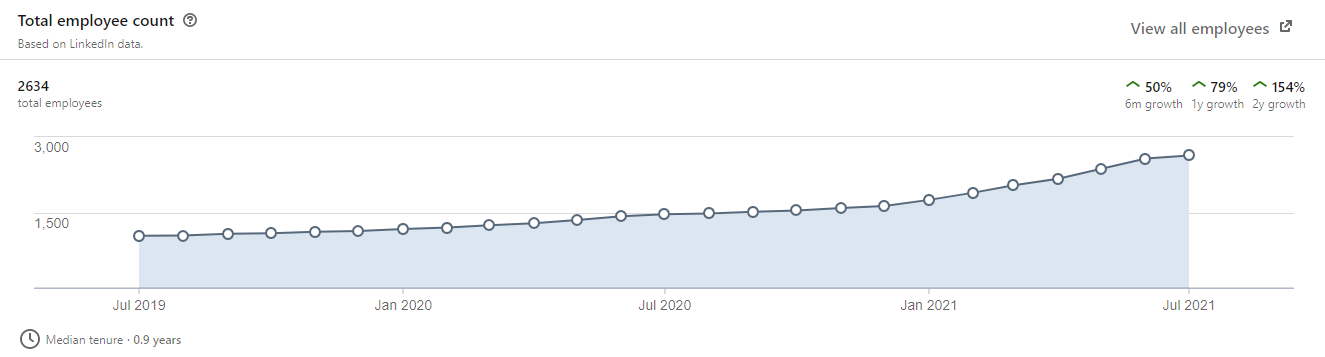
50% six month total headcount growth
13% increase in engineering department headcount over last three months
Noticeable uptick in hiring YTD with June having the largest number of new hires
55% increase in engineering related job listings over last three months
Median tenure 0.9 years
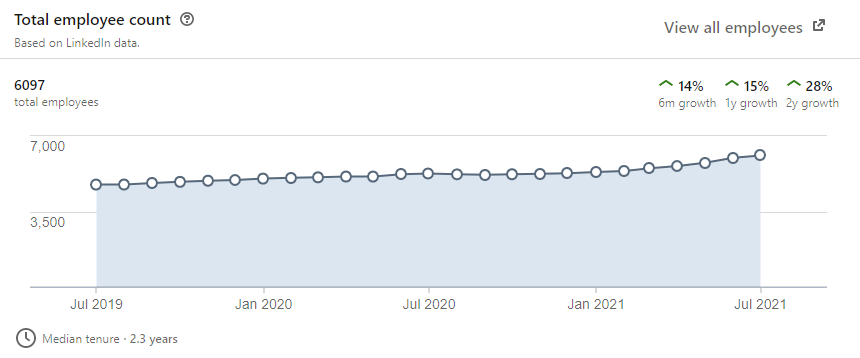
Coupang
Ticker: CPNG


15% six month total headcount growth
Engineering department largest in company which grew 66% over the last six months
Ramp up in hiring since last summer then a slight decline in hiring Q2?
Median tenure 1.6 years
Cricut
Ticker: CRCT


21% six month headcount increase
Single digit growth across the board in field specific headcount over last three months
Noticeable uptick in hiring last winter which has stayed elevated
59% increase of engineering related job openings over last three months
Median tenure 1.8 years
Digital Turbine
Ticker: APP


5% six month total headcount growth
Biggest increase in engineering department headcount up 37% over last year
More active in senior management hires this year, steady rate of normal hiring
Triple digit growth in engineering and marketing job listings over the last 3 months
Median tenure 2.3 years
DLocal
Ticker: DLO


37% six month total headcount growth
8% increase in engineering headcount over last three months
Ramp up in hiring YTD which had strongest hiring month in March
691% increase in total job listings over last three months (watch for law of small numbers)
Median tenure 1.0 years
DraftKings
Ticker: DKNG
12% six month total headcount growth
4% increase in engineering department headcount over last three months
Can you tell where they got that SPAC money on the new hires distribution
15% increase in engineering related job openings over last three months
Median tenure 1.3 years
Etsy
Ticker: ETSY


5% six month total headcount increase
6% increase in total engineering department headcount over last three months
Steady rate of new hires over the last 18 months with a big increase last summer
Over half the Etsy job listings are for engineering positions and up 86% over last 3 months! IT also very strong
Median tenure 3.2 years
Facebook
Ticker: FB
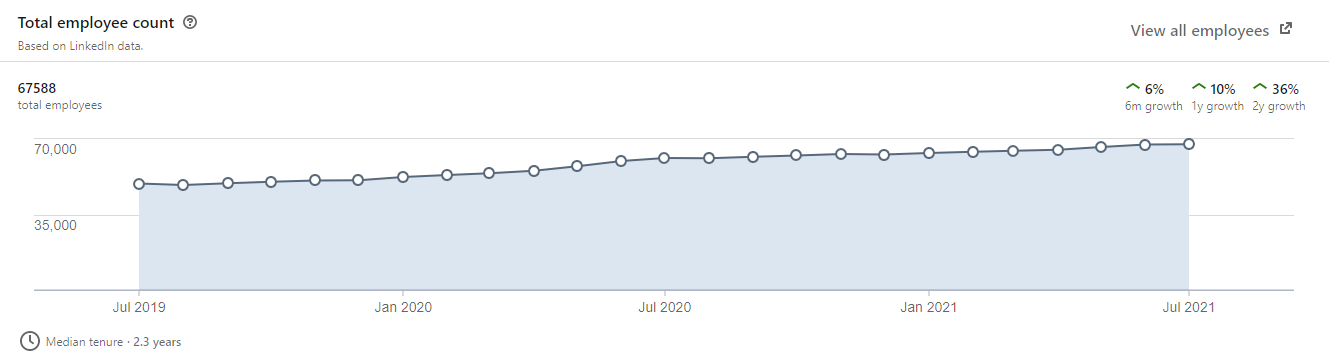
6% six month total headcount growth
3% increase in engineering department total headcount over last three months
Steady hiring patterns that had most hires in June 2020
Median tenure 2.3 years
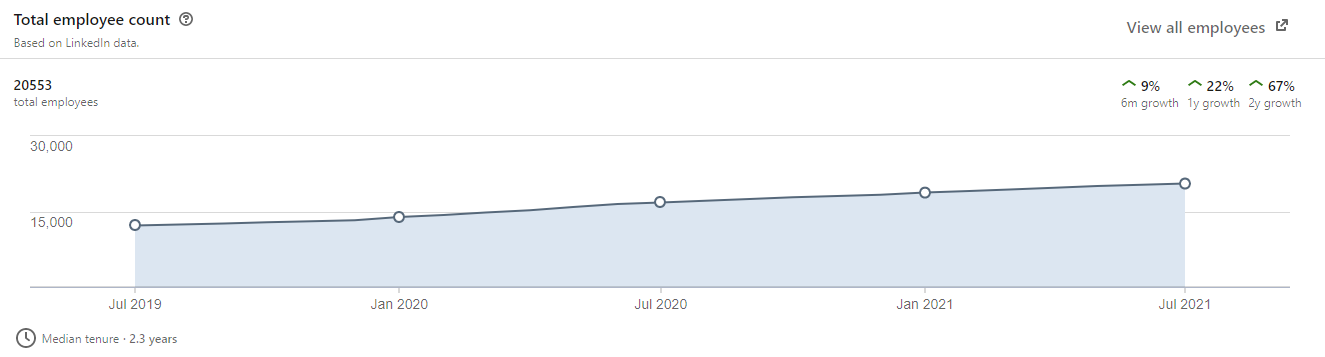
9% six month total headcount growth
Flat rate of hiring over the last year, peaked 1H of 2020
373% increase in Marketing department job listings over the last three months
Median tenure 2.3 years
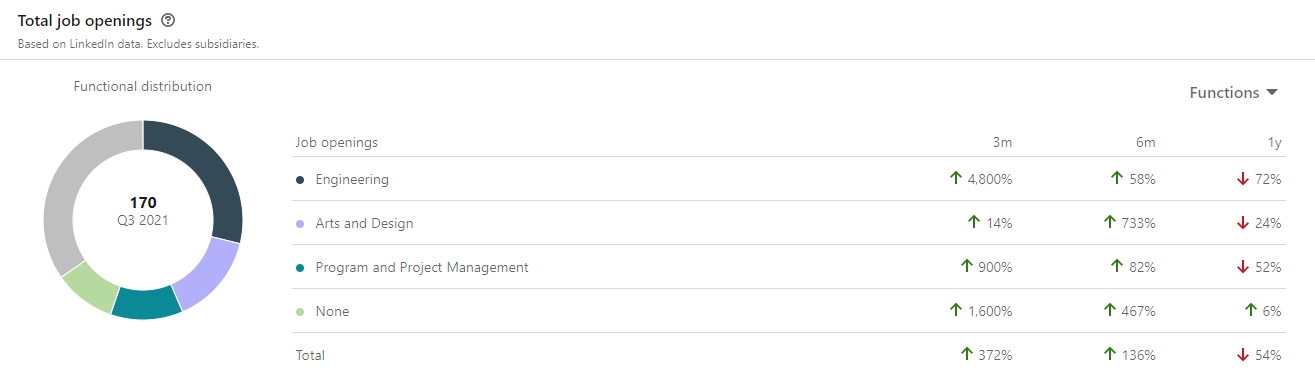
Oculus VR
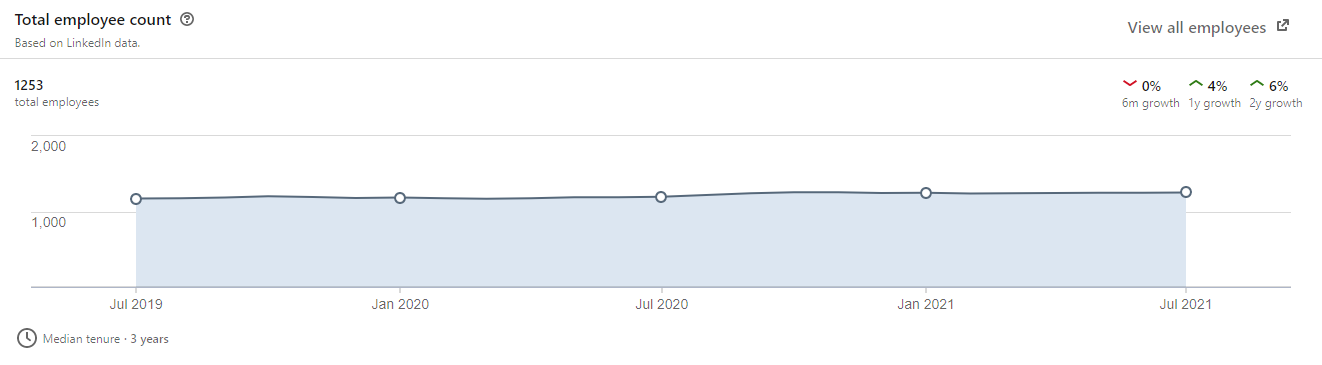
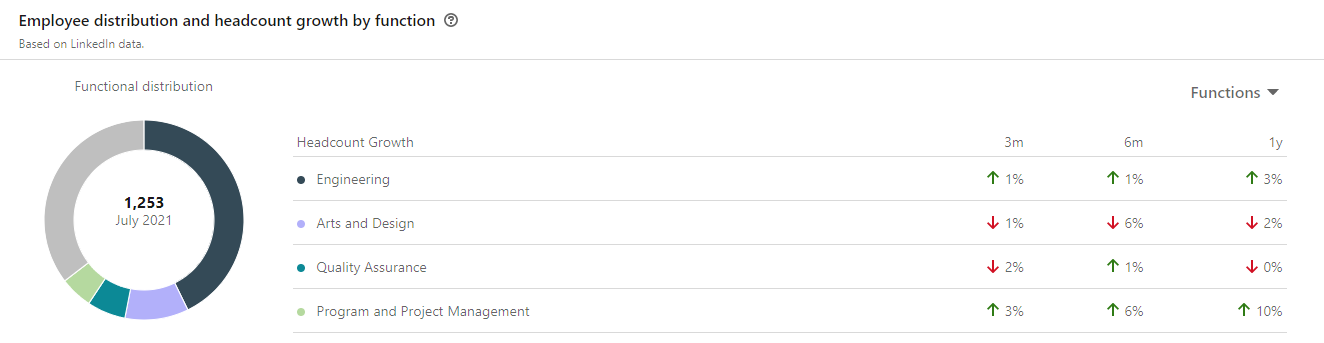
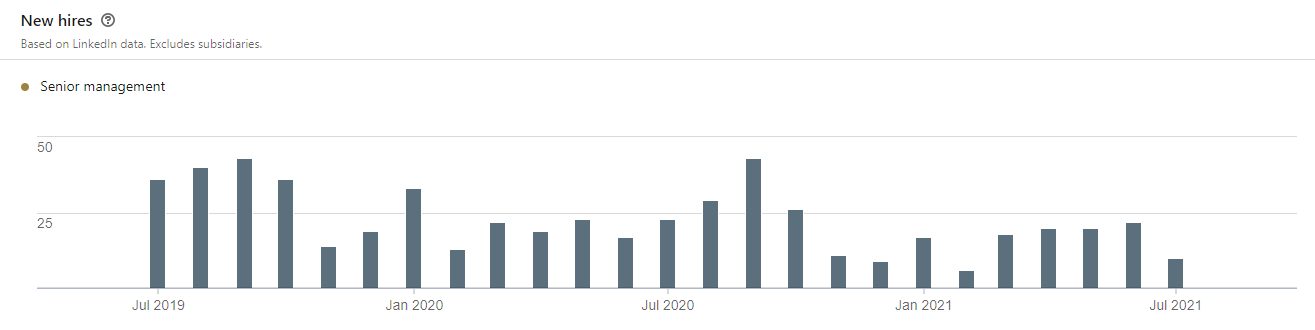
0% six month total headcount growth
Flat department wide headcount over top departments
Tapered rate of hiring over the last 9 months
Looks like they’re gearing up for next wave of Engineer new hires with a 4800% increase in job listings over the last three months
Median tenure 3.0 years
Fastly
Ticker: FSLY


5% six month total headcount growth
Very clean headcount distribution with 4 departments making up almost 75% of total company headcount
Steady hiring outside big push last October - Weird job openings numbers, could be getting filled outside LinkedIn? no clue
Median tenure 1.9 years
Genius Sports
Ticker: GENI


12% six month total headcount growth
23% increase in engineer headcount last six months
Noticeable uptick in hiring YTD with more senior management hiring
20% increase in total job openings over the last three months
Median tenure 2.2 years
Global-E
Ticker: GLBE
18% six month total headcount growth
6% increase in headcount of IT department over last three months
Elevated rate of hiring over the last year but steady overall
Engineering department job listings increased 475% over the last three months
Median tenure 1.6 years
GoodRx
Ticker: GDRX


29% six month total headcount growth
Very active hiring in supporting departments
June saw big hiring uptick and has increasing each month this year
Triple digit job listing increase for engineering department over last three months
Median tenure 1.3 years
Lemonade
Ticker: LMND
22% six month total headcount growth
3% increase in engineering department headcount over last three months
Steady rate of hiring over last year
289% increase in total job listings over the last three months
Median tenure 1.1 years
Lightspeed
Ticker: LSPD


19% six month total headcount growth
Strongest growth in sales department headcount up 31% over the last six months
Last year has seen an elevated pace of hiring
Triple digit growth in job listings with Support roles leading the way
Median tenure 1.6 years
Lucid Motors
Ticker: LCID


37% 6-month total headcount increase!
Strong hiring across all operations and engineering recently -
May and June saw the largest amount of hires -
Engineering job openings increased 32% over last three months
Median tenure 0.9 years
Magnite
Ticker: MGNI


10% six month total headcount growth
Business development seeing biggest increase in department headcount up 21% over last three months
Seem to do an interesting hiring process of bulk swings with big uptick in hiring this month. Also saw a big hiring increase across these June-July months last year as well
Median tenure 1.3 years
Matterport
Ticker: MTTR


35% six month total headcount increase
Looks like they had to let people go when COVID hit (?) but now hitting the gas on hiring this year
Interesting the Sales dept has largest headcount for a B2B company
Triple digit job listing increase over last three months
Median tenure 1.7 years
MercadoLibre
Ticker: MELI


23% six month total headcount growth (!)
9% increase in engineering headcount over last three months
Noticeable uptick in hiring rate in Q2 peaking last month
87% increase in engineering job listings over last three months
Median tenure 1.4 years
PayPal
Ticker: PYPL
PayPal
6% six month total headcount growth
3% increase in engineering department headcount over last three months
Seem to have a seasonal pattern of decreasing hiring rate over the year and picks up again in January
110% total job listings increase over the last three months
Median tenure 3.1 years
Venmo
4% six-month total headcount growth
Flat headcount change among the top departments, engineering department headcount increased 1% over last three months
Flat rate of hiring over the last 1.5 years
Engineer job listings increased 221% over last three months
Median tenure 1.9 years
Peloton
Ticker: PTON


24% six month total headcount increase
10% increase in engineering headcount over last three months
Big uptick in hiring rate over the last year
85% increase in engineer job openings over last three months
Median tenure 1.0 years
Pinterest
Ticker: PINS


18% six month total headcount increase
Steady single digit % increase of headcount by department in last three months, engineer department has largest headcount
Big uptick in hiring YTD on hiring distribution
Engineering job openings up 123% last six months
Median tenure 1.9 years
Progyny
Ticker: PGNY


20% six month total headcount growth -
Strong recent hiring in healthcare services and biz development
Last month big uptick in hiring along with senior management
Triple digit growth in engineering job openings and overall up 48% over last three months
Median tenure 1.9 years
PubMatic
Ticker: PUBM


9% 6-month total headcount growth
Stagnant headcount change over the last three months by department with strongest hiring in IT department
68% increase in engineering related job listings over the last three months
Median tenure 2.7 years
Redfin
Ticker: RDFN


14% six month total headcount growth
Beautiful headcount distribution with Agents, Support, Engineers and Sales making up over 75% of total headcount
Big uptick in hiring 1Q this year
Biggest uptick in engineering job listings with increase of 101% over last three months
Median tenure 2.4 years
Robinhood
Ticker: HOOD
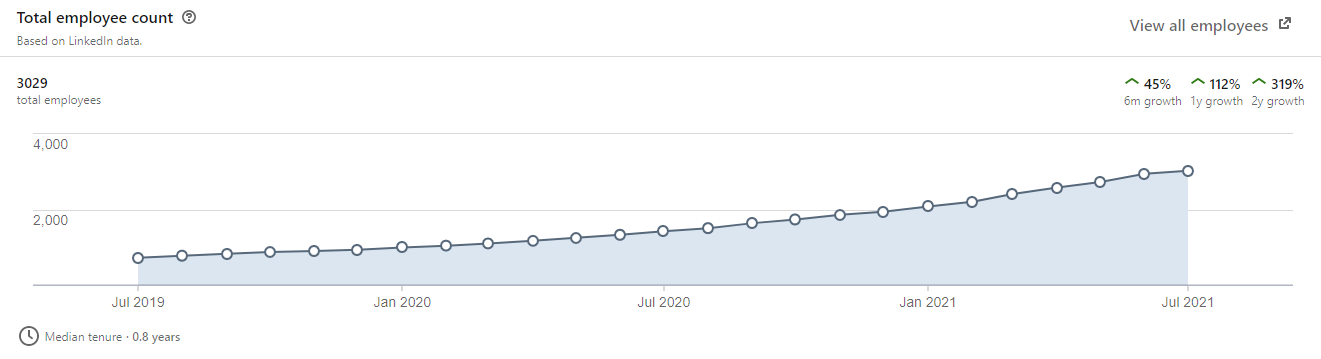
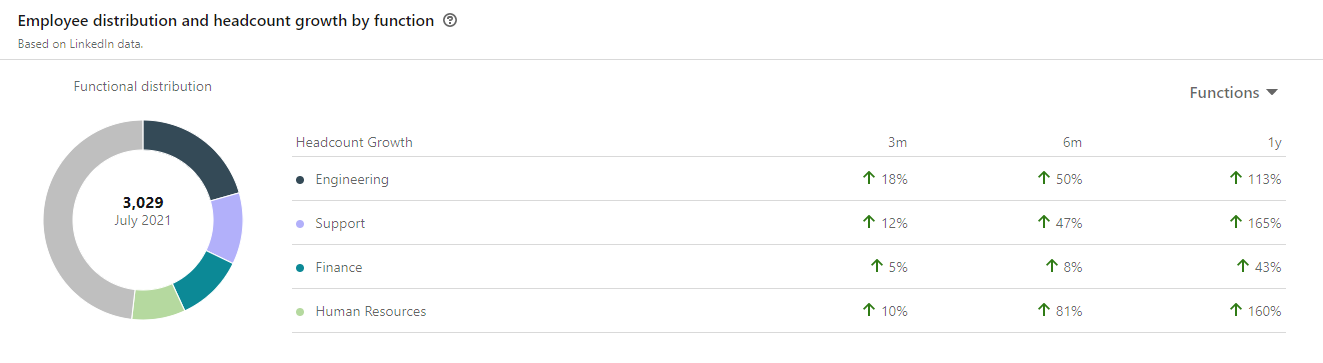
45% six month total headcount growth
18% engineer department headcount increase over last three months
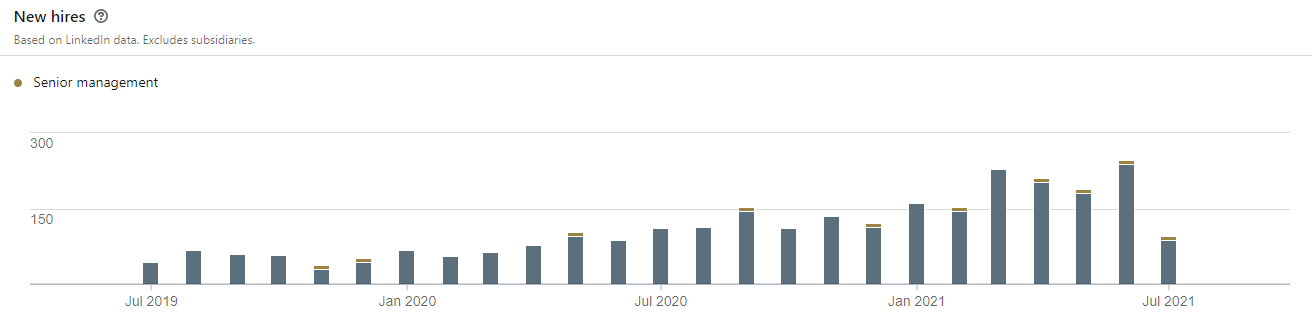
Ramp up in hiring over 2Q peaking last month
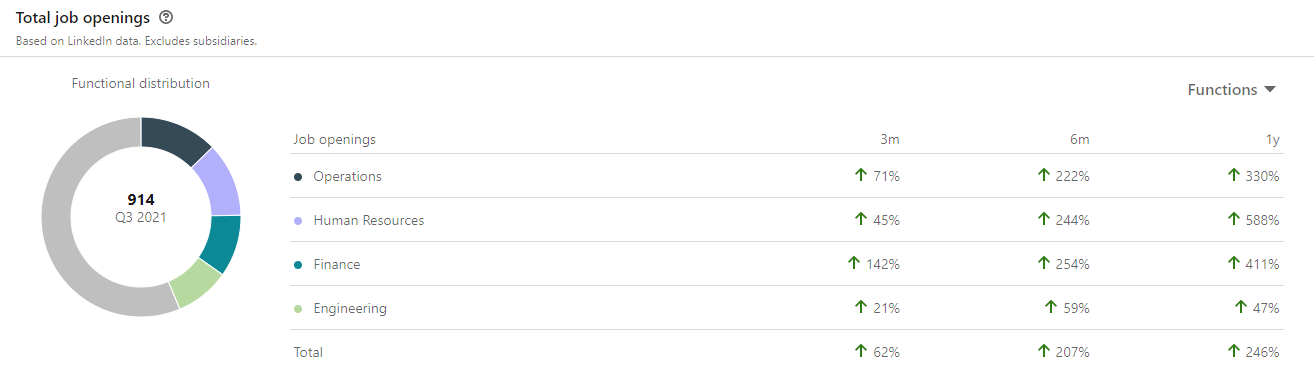
62% total job listings increase over the last three months
Median tenure 0.8 years
Restoration Hardware
Ticker: RH


7% six month total headcount growth
Ramping up hiring in the last year
188% increase in total job listings over the last six months
Median tenure 3.8 years
Roblox
Ticker: RBLX


19% six month total headcount increase
7% increase in engineering headcount over last three months
Small uptick in hiring in Q2
30% decrease in engineer job listings over last three months tells me they hired them off LinkedIn maybe?
Median tenure 1.9 years
Roku
Ticker: ROKU


24% six month total headcount growth
Engineering department is over 36% of total headcount and grew 5% over the last three months
Hiring distribution shows noticeable uptick this year
171% increase in engineering related job openings over last six months
Median tenure 1.8 years
Salesforce
Ticker: CRM


7% six month total headcount growth
Sales and Engineers makeup over half of company headcount
Slightly elevated hiringr YTD with more senior management hires than normal
High double digit growth in job listings across the board last 3 months!
Median tenure 2.6 years
Sea Limited
Ticker: SE
Sea Group


7% six month total headcount increase
Upticks across the board in field specific headcount but nothing insane
Hiring seems at a steady rate last two years
275% increase in total job listings over the last three months
Median tenure 3.1 years
Shopee


27% six month total headcount increase
10% 3-month increase in engineering headcount
Elevated hiring since June 2020 and has stayed consistent
Marketing has the most positions open followed by engineering - all at triple digit increase over last three months
Median tenure 1 year
Garena


21% six month total headcount increase
You can tell where SE hit the gas on Shopee where it shows the dip in the new hires distribution haha
124% increase in total job listings over the last three months
Median tenure 1.4 years
Shopify
Ticker: SHOP


17% six month total headcount increase
Engineer department 8% headcount growth over the last three months
Biggest uptick in hiring in Q2
Impressive 129% increase in engineering related job openings
Median tenure 1.8 years
Snap Inc
Ticker: SNAP
14% six month total headcount growth
7% increase in engineering department headcount over last three months
Ramp up in hiring Q2 peaking last month (wish I posted this before they just reported killer earnings LOL)
88% increase in engineering related job listings over last three months
Median tenure 2.5 years
SoFi
Ticker: SOFI
SoFi


12% six month total headcount growth
6% six month increase in engineer department headcount
Uptick in new hires YTD peaking in March ‘21
Job openings down over last three months by 23% but up 95% over last six months. Recent hires not from LinkedIn?
Median tenure 2.3 years
Galileo


9% six month total headcount increase
Flat across top departments headcount over last three months
Uptick in hiring last summer with it tapering off a bit
116% increase in engineering related job listings over last three months
Median tenure 1.5 years
Square
Ticker: SQ
Square


19% six month total headcount growth
High single digit increase in headcount last three months
Slightly stronger hiring in Q2
51% increase of engineering related job listings over last three months
Median tenure 1.8 years
Cash App


40% six month total headcount growth
12% increase in engineering headcount over last three months
Ramping up hiring last nine months with strongest hiring in last month
88% increase in engineering related job openings over the last three months
Median tenure 0.8 years
Stem Inc
Ticker: STEM


20% six month employee headcount growth
Biggest uptick in sales headcount up 11% last three months
Huge increase in rate of hires YTD
108% increase in engineering job listings over last three months
Median tenure 2.6 years
Stitch Fix
Ticker: SFIX


4% 6-month total headcount growth -
Big uptick in hiring last summer then tapered off a bit -
40% increase in engineer job openings last three months
Median tenure 2.4 years
Teladoc
Ticker: TDOC


10% six month total headcount growth
14% increase in engineer department headcount over last six months
Triple digit growth in job listings over last three months with Engineer & Operations listings leading the way
Median tenure 1.3 years
Tesla
Ticker: TSLA


12% six month total headcount growth
Noticeable uptick in hiring the last year
31% growth in total job openings over last three months
Median tenure 2.2 years
The Trade Desk
Ticker: TTD


17% six month total headcount growth
Very clean company headcount distribution with double digit six month department headcount growth across board
Noticeable uptick in hiring YTD
278% increase in in engineering related job postings over last three months
Median tenure 2.2 years
Twilio
Ticker: TWLO


28% six month total headcount increase
11% increase in engineering department headcount over last three months
Ramping up in hiring in Q2 looks like with June the largest hiring month over last two years
34% increase in engineering job listings over last three months
Median tenure 1.3 years
Twitter
Ticker: TWTR
10% six month total headcount growth
5% increase in engineering department headcount over last three months
Noticeable ramp up in hiring YTD (again would’ve been nice to post this yesterday before they killed earnings LOL)
34% increase in product management related job listings over last three months
Median tenure 2.5 years
Upstart
Ticker: UPST


49% six month total headcount growth
11% & 8% increase in finance and engineering department headcount over last three months
Ramped up hiring YTD with biggest increase in April
65% total job listings increase over last three months
Median tenure 0.9 years
Weedmaps
Ticker: MAPS


6% six month total headcount increase
Engineering department make up most headcount and grew 3% over last three months
Uptick in hiring YTD with more senior management
26% increase in engineering related job listings over last three months
Median tenure 2.3 years
Zillow
Ticker: Z


14% six month total headcount growth
5% three month increase in engineering department headcount
Very noticeable uptick in hiring YTD and especially Q2
Big increase across the board in job openings - most notable 1208% increase for operations based positions over last six months
Highlights
I plan on doing a full newsletter on this topic before every earnings season as I think it gives some great insights on how a company potentially did over the previous quarter (see Snap and Twitter sections)!
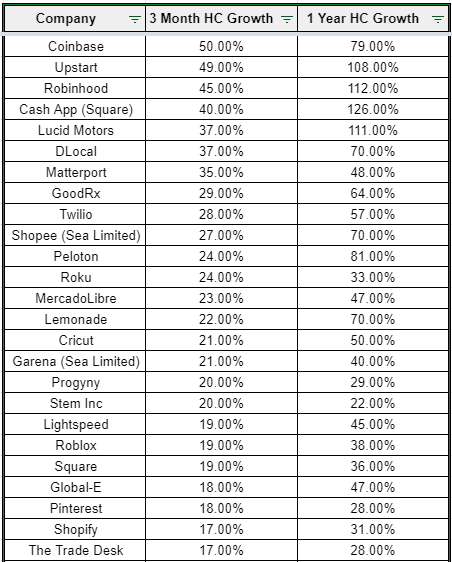
Taking a look at the top 25 companies experiencing the largest three month total headcount growth:
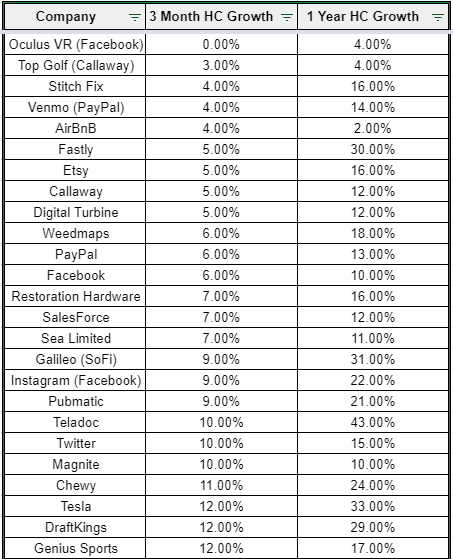
Now taking a look at the top 25 companies experiencing the smallest three month total headcount growth:
The three main things I personally looked for in doing:
A ramp up in hiring rate over the last six months
Total headcount growth of at least 10% over the last three months
Engineer headcount growth and job listing growth for tech based companies (90% of this list haha)
Companies that fall under this bucket:
UPST
COIN
TWLO
HOOD (this will be quite the interesting IPO)
LCID
SQ
SE
DLO
MELI
PINS
SNAP
TWTR
One thing I found interesting is how unattractive Oculus VR’s insights looked for what is made as the “growth story” inside FB but maybe I just don’t know enough about the business.
I hope you found these insights interesting and an easier way to consume this information versus the jumbled thread on twitter. None of this should be taken as investment advice!
- Sean