


Q2 2022: Sector Analysis
The Jiggy Capital Newsletter #15

Overview
For the first and very late newsletter of Q2 2022, I’m going to be doing my fourth edition of Sector Analysis. Once again I’ve trimmed the groupings down beginning with 14, then 9 and now 6.
It’s quite incredible the speed in which we’ve seen technology companies multiples contract over the last 6 months — but it could be argued the prior two years were just as bizarre. Regardless, multiples across the board are a helluva lot more attractive than they have been in quite some time so I was excited to put this together and see what really stood out as so much is down 50%+ from local highs.
The spreadsheet containing all the below data can be found here and can also be found on my Substack home page side bar.
I’ll be breaking down each sector into 5 main parts:
Charts: This will be where the EV/GP and EV/EBITDA scatter plots will be shown. I decided I’m not going to publish the full spreadsheet data this time around since it was so messy last time but I’ll be linking my spreadsheet public to view at the bottom.
2022-2024 Projected Revenue CAGR vs. Enterprise Value / 2023 Expected Gross Profit (EV/2023 GP) Scatter Plot
2022-2024 Projected Revenue CAGR vs. Enterprise Value / 2023 Expected EBITDA (EV/2023 EBITDA) Scatter Plot
For the three software sections, I’ll be using FCF instead.
2022e Rule of 40 Group Chart
Where the scatter plot dots have a color code:
Green = Company is EBITDA positive in 2022
Orange = Company is projected to be EBITDA positive by 2024
Red = Company is not projected to be EBITDA positive by 2024
Sector Stats: I’ll be highlighting the sectors median 2021-2023 revenue CAGR, gross margins, EV/2022e GP and EV/2022e EBITDA multiples. I’ll use averages for sectors with a dataset under 10 companies.
Sector Highlights: I’ll be highlighting the companies with the strongest and weakest gross margins, EBITDA margins, and 2022-2024 projected revenue CAGR.
Scatter Plot Trendline Error Percentage: Using the sector scatter plot generated trendline equation, I look at the biggest discrepancies between their actual EV/2023e GP and EBITDA multiples versus their expected ones.
My Take: A quick one or two sentence take on the output data.
The forward projections are taken from Koyfin average analyst estimates, which I use multiple times a day and think it’s the best service out there for any fundamental company analysis. I also use their Enterprise Value data, and the rest comes from google finance function on google sheets.
The sectors I will be looking at in the newsletter are:
Application Software
Financial Services
Infrastructure Software
Internet
Semiconductor
Software
Before we get started, I want to go over key assumptions:
I’m assuming the financial information gathered is correct - Please let me know if something is off for a company I’d be happy to look into it further and correct it.
I’m assuming with gross profit projections their gross profit margin won’t change - This obviously isn’t reality as margins expand/contract over time as a companies business changes/scales but this is the best I can do (as of now at least).
This was a big reason why I thought the EBITDA multiples addition would be a good idea as I get those direct numbers from Koyfin, whereas with GP projections I use their analyst projected revenue and multiply it by their 2020 gross profit margin.
Gross profit margin is also a metric that can be left for some company interpretation where you can hide some costs elsewhere down the line items.
This is not looking at the quality of a company, management, market position, runway, and even more importantly the quality of revenue profile (recurring vs transaction-based vs unrelated one-time revenues).
Something to be mindful of as well with the EBITDA/FCF scatter plots are some of the extremely high multiples like Elastic are just reaching that FCF profitability inflection point but early in that.
To state the obvious — this is only one piece of the puzzle and shouldn’t be used as financial advice and taken with a grain of salt :)
Now let’s get into it!
Sector Analysis
Application Software
Group (45): Adobe (ADBE), Autodesk (ADSK), Amplitude (AMPL), Asana (ASAN), BigCommerce (BIGC), Bill.com (BILL), Blackline (BL), Braze (BRZE), Ceridian (CDAY), Coupa (COUP), Salesforce (CRM), Sprinklr (CXM), Docusign (DOCU), Expensify (EXFY), Five9 (FIVN), Freshworks (FRSH), Alphabet (GOOG), HubSpot (HUBS), Intuit (INTU), Lightspeed (LSPD), Monday.com (MNDY), Microsoft (MSFT), Nice (NICE), ServiceNow (NOW), Olo (OLO), Oracle (ORCL), Paycom (PAYC), Procore (PCOR), Paylocity (PCTY), Powerschool (PWSC), RingCentral (RNG), Semrush (SEMR), Shopify (SHOP), Smartsheet (SMAR), Sprout Social (SPT), Squarespace (SQSP), Atlassian (TEAM), Toast (TOST), Tyler (TYL), Veeva (VEEV), Workday (WDAY), Zendesk (ZEN), Zoom (ZM)
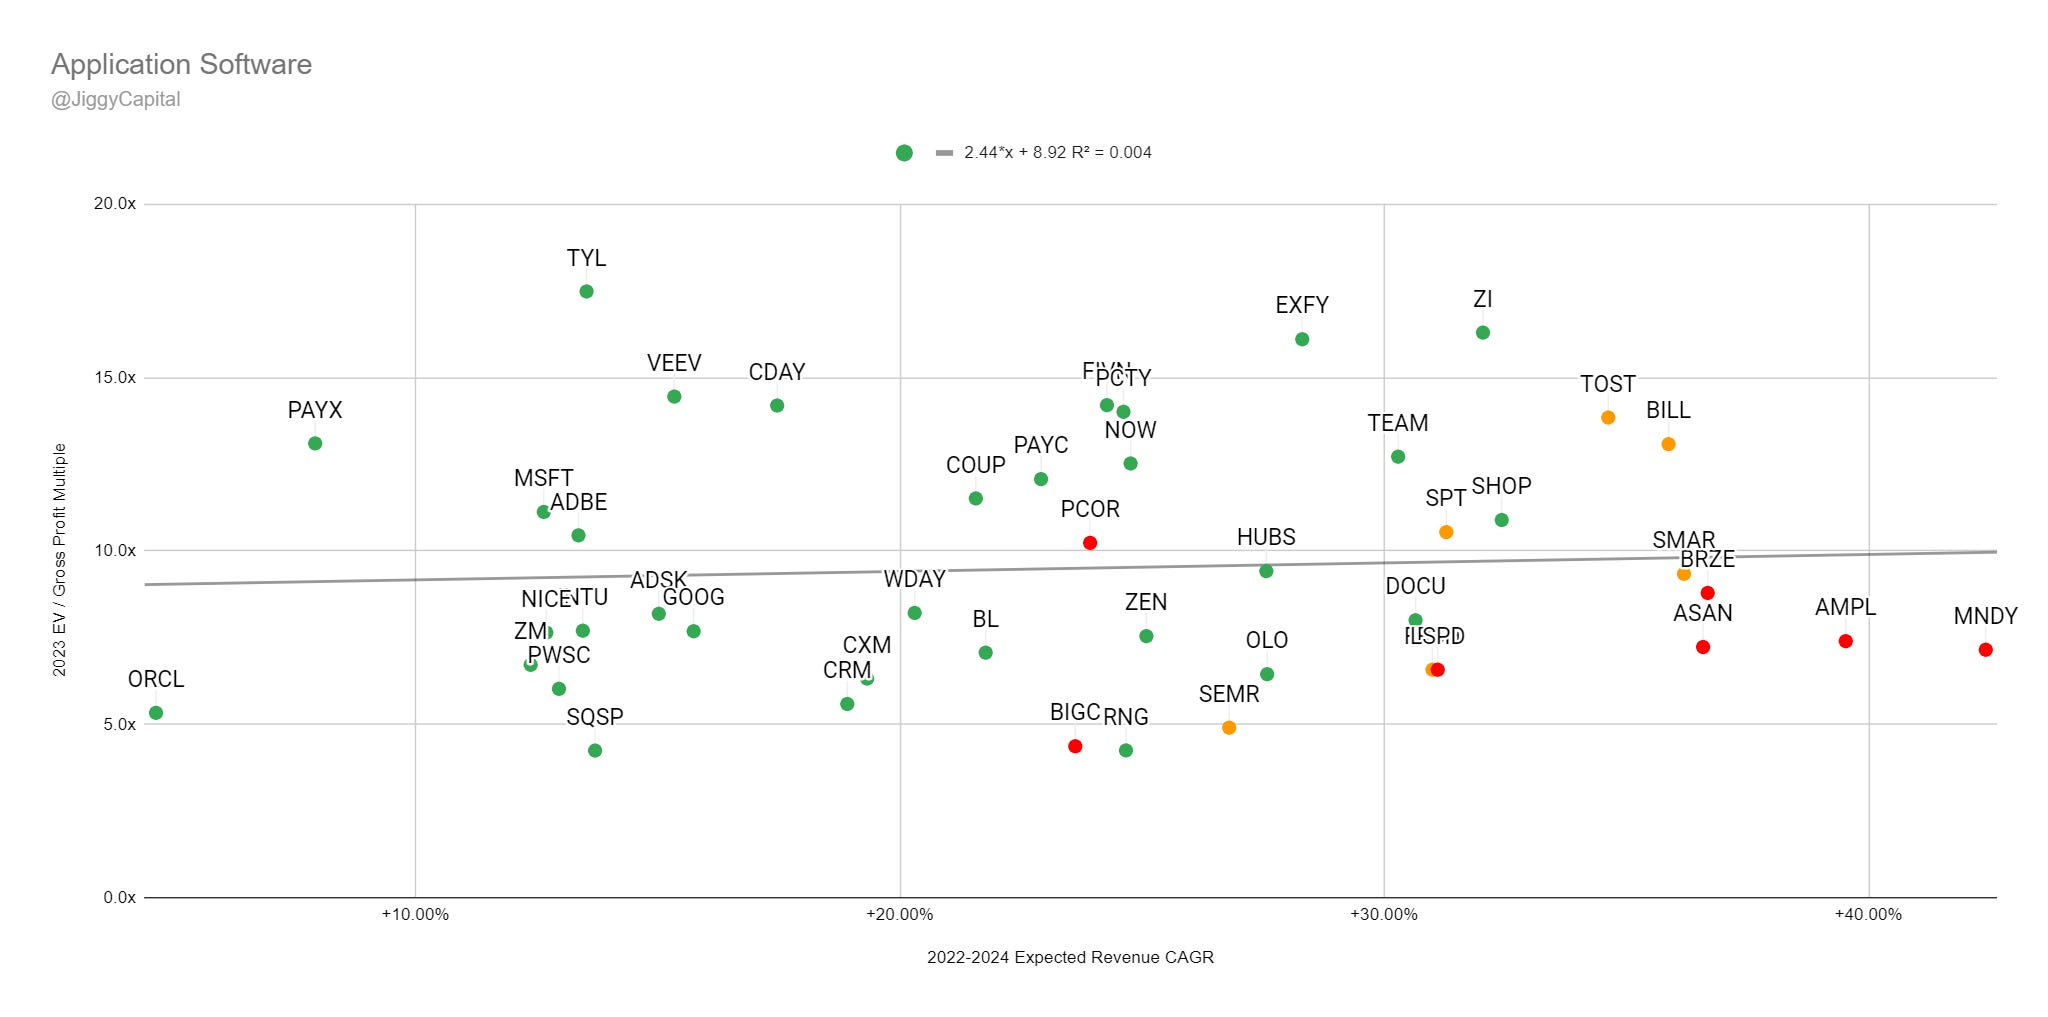
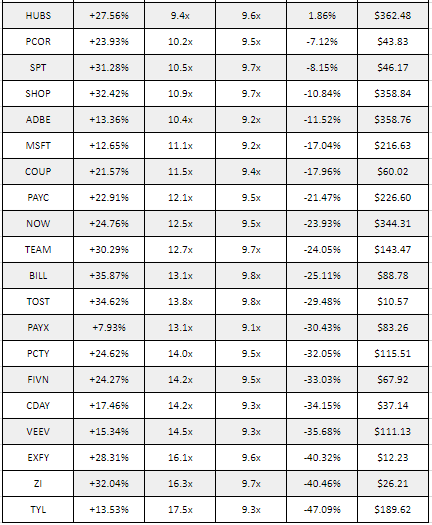
2022-2024 Revenue CAGR vs EV/2023 Gross Profit Multiple:
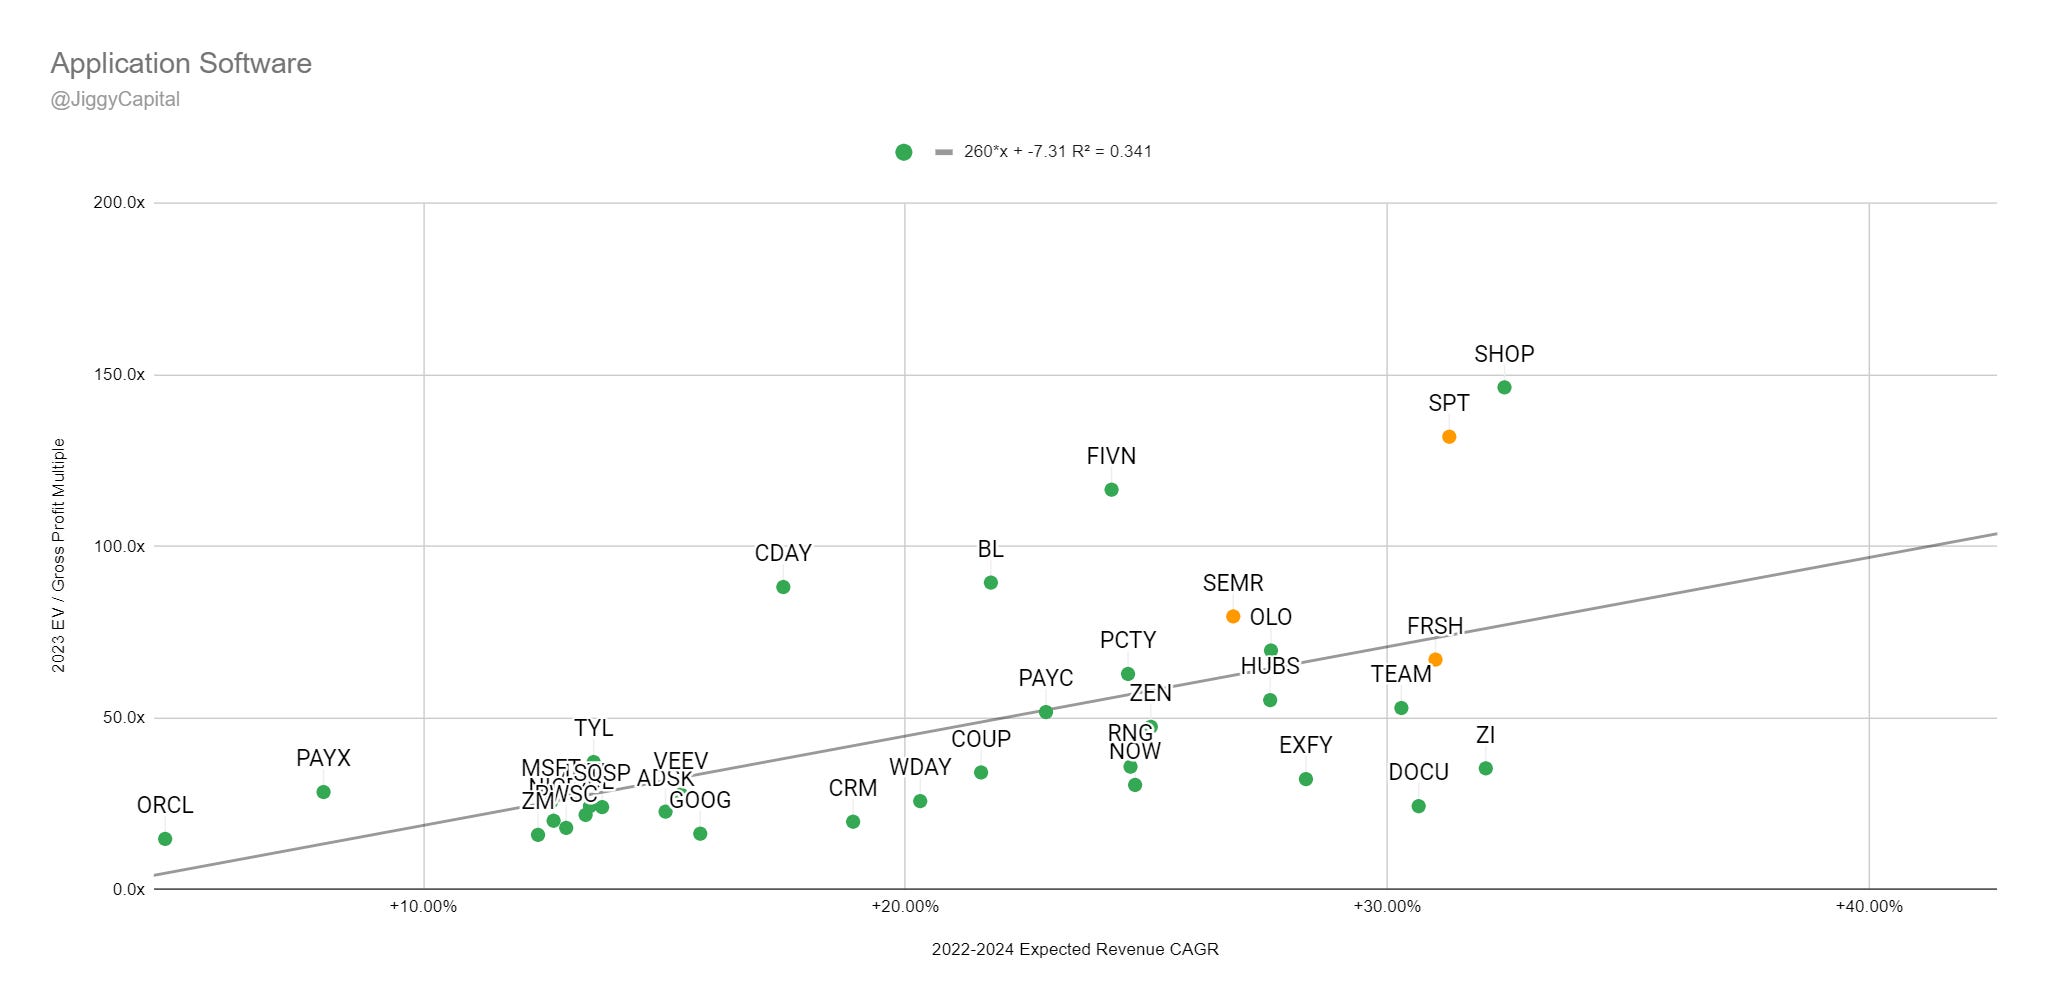
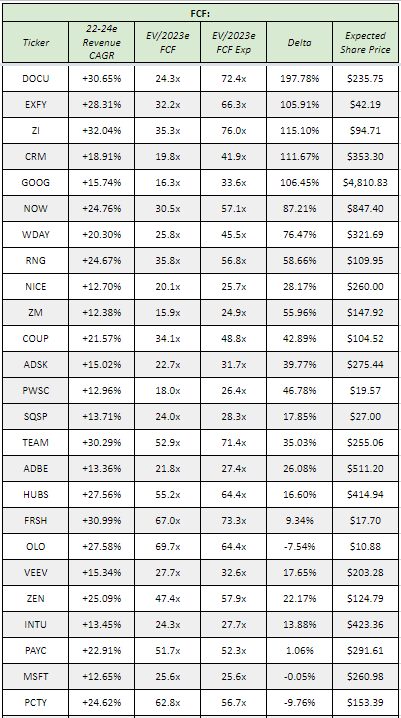
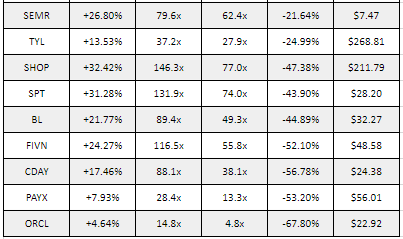
2022-2024 Revenue CAGR vs EV/2023 FCF Multiple:
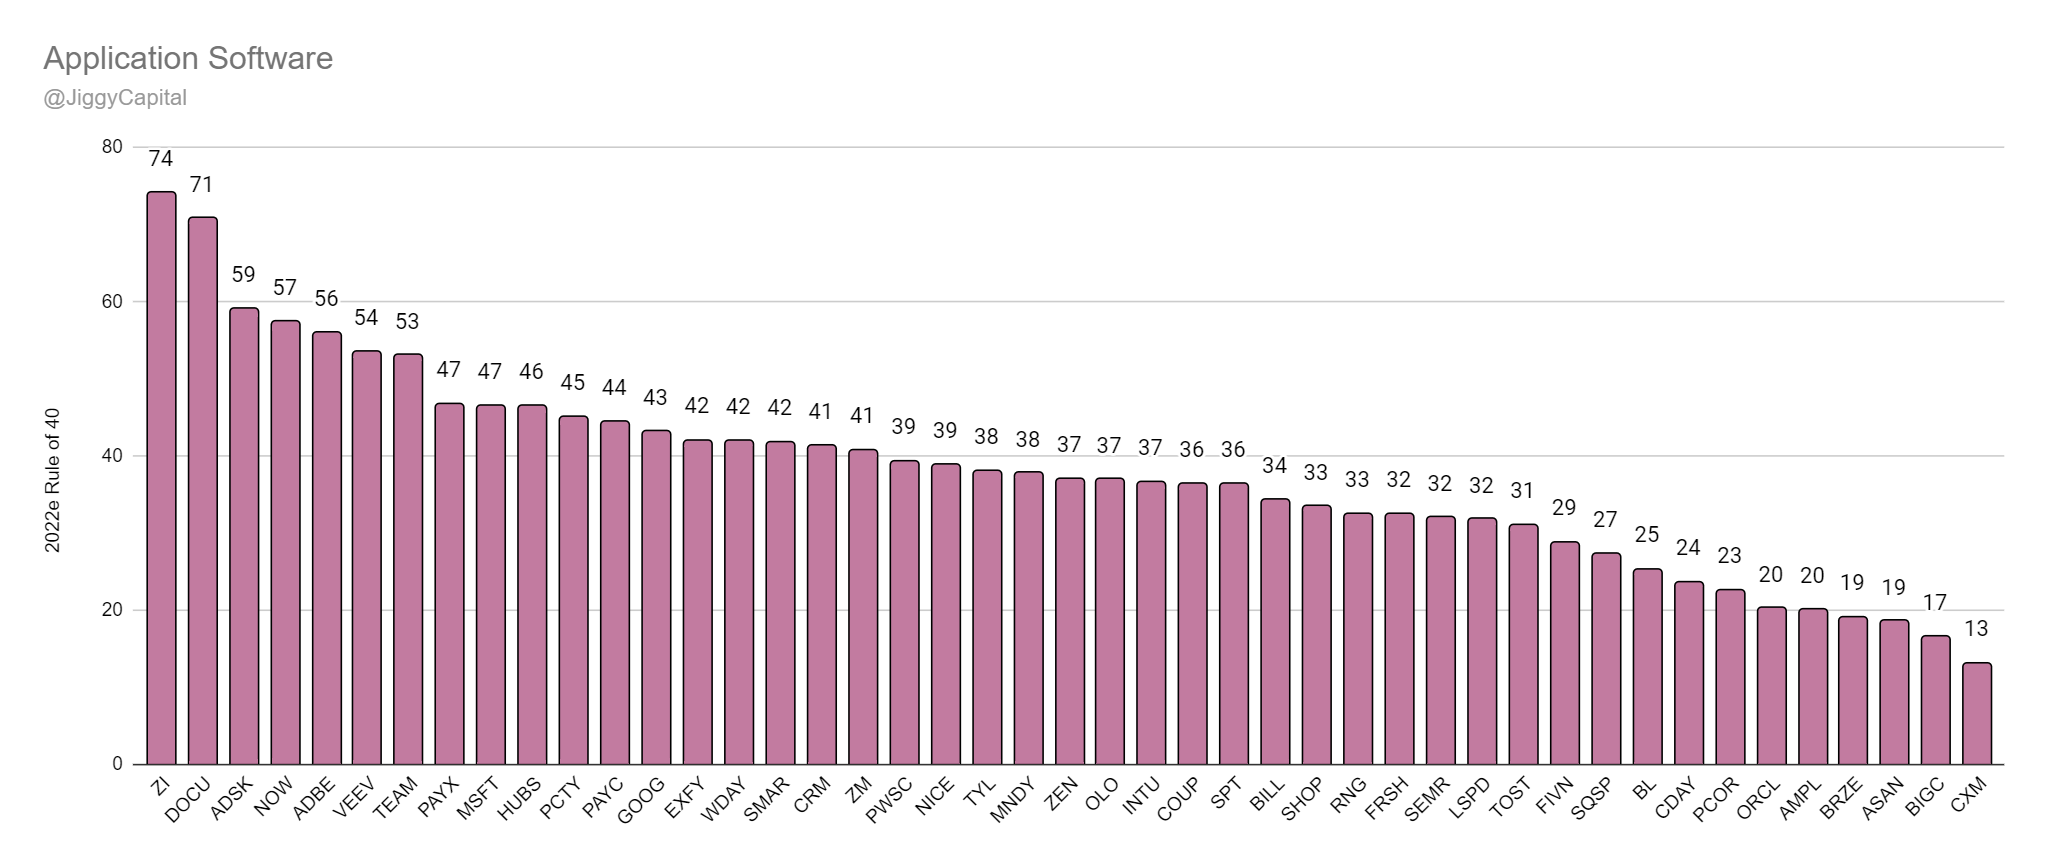
2022e Rule of 40 Scores:
Sector Stats:
Median Gross Margins: 74.6%
Median 2022e FCF Margin: 14.00%
Median 2022-2024 Projected Revenue CAGR: 24.1%
Median 2022e Rule of 40 Score: 37
Median 2022e FCF Yield %: 1.47%
Median EV/2023e GP Multiple: 8.2x
Median EV/2023e FCF Multiple: 33.2x
Sector Highlights:
Best Gross Margins: Autodesk — 92%
Best 2022e FCF Margins: Autodesk — 42%
Best 2022-2024 Projected Revenue CAGR: Monday.com — 42%
Best 2022e Rule of 40 Score: ZoomInfo — 74
Best 2022e FCF Yield %: Zoom — 5.49%
Worst Gross Margins: Ceridian — 42%
Worst 2022e FCF Margins: Braze — -21%
Worst 2022-2024 Projected Revenue CAGR: Oracle — 4%
Worst 2022e Rule of 40 Score: Sprinklr — 13
Worst 2022e FCF Yield %: Amplitude — -2.96%
Scatter Plot Trendline Error Percentage:
“Undervalued”:
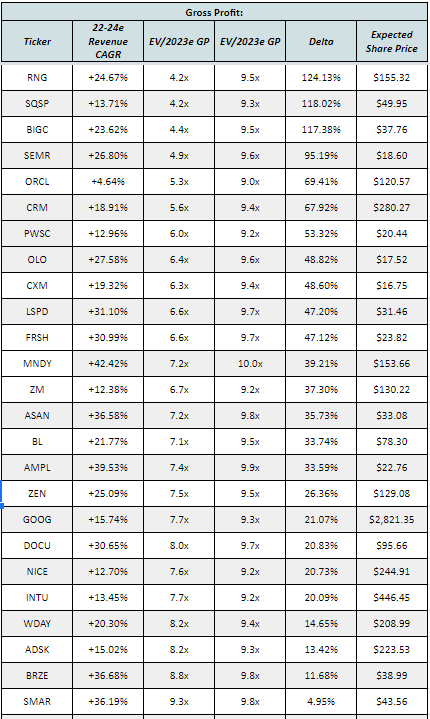
Gross Profit: RingCentral (+124%)
EBITDA: DocuSign (+197%)
“Overvalued”:
Gross Profit: Tyler Technologies (-47%)
EBITDA: Oracle (-67%)
Full Data:
Gross Profit:
EBITDA:
My Take:
RingCentral and the CPaaS space in general especially haven’t been shown love by the market for most of the last year or so despite still solid underlying fundamentals.
Autodesk and Adobe both just have such amazing margins to ride in at their more steady state compared to other software players. I personally think (talking my own book alert) companies like Salesforce and ServiceNow, and then even HubSpot and Atlassian are very a nice blend of growth and profitability within this group at these valuations.
Financial Services
Group (27): Adyen (ADYEY), Affirm (AFRM), Avalara (AVLR), American Express (AXP), Bill.com (BILL), Blend Labs (BLND), Cboe (CBOE), Coinbase (COIN), dLocal (DLO), Fair Isaac (FICO), Shift4 Payments (FOUR), Global-E (GLBE), Robinhood (HOOD), Intercontinental Exchange (ICE), Lightspeed (LSPD), Mastercard (MA), Marqeta (MQ), Msci (MSCI), Nu (NU), Nuvei (NVEI), Paypal (PYPL), SoFi (SOFI), S&P Global (SPGI), Block (SQ), Toast (TOST), Upstart (UPST), Visa (V)
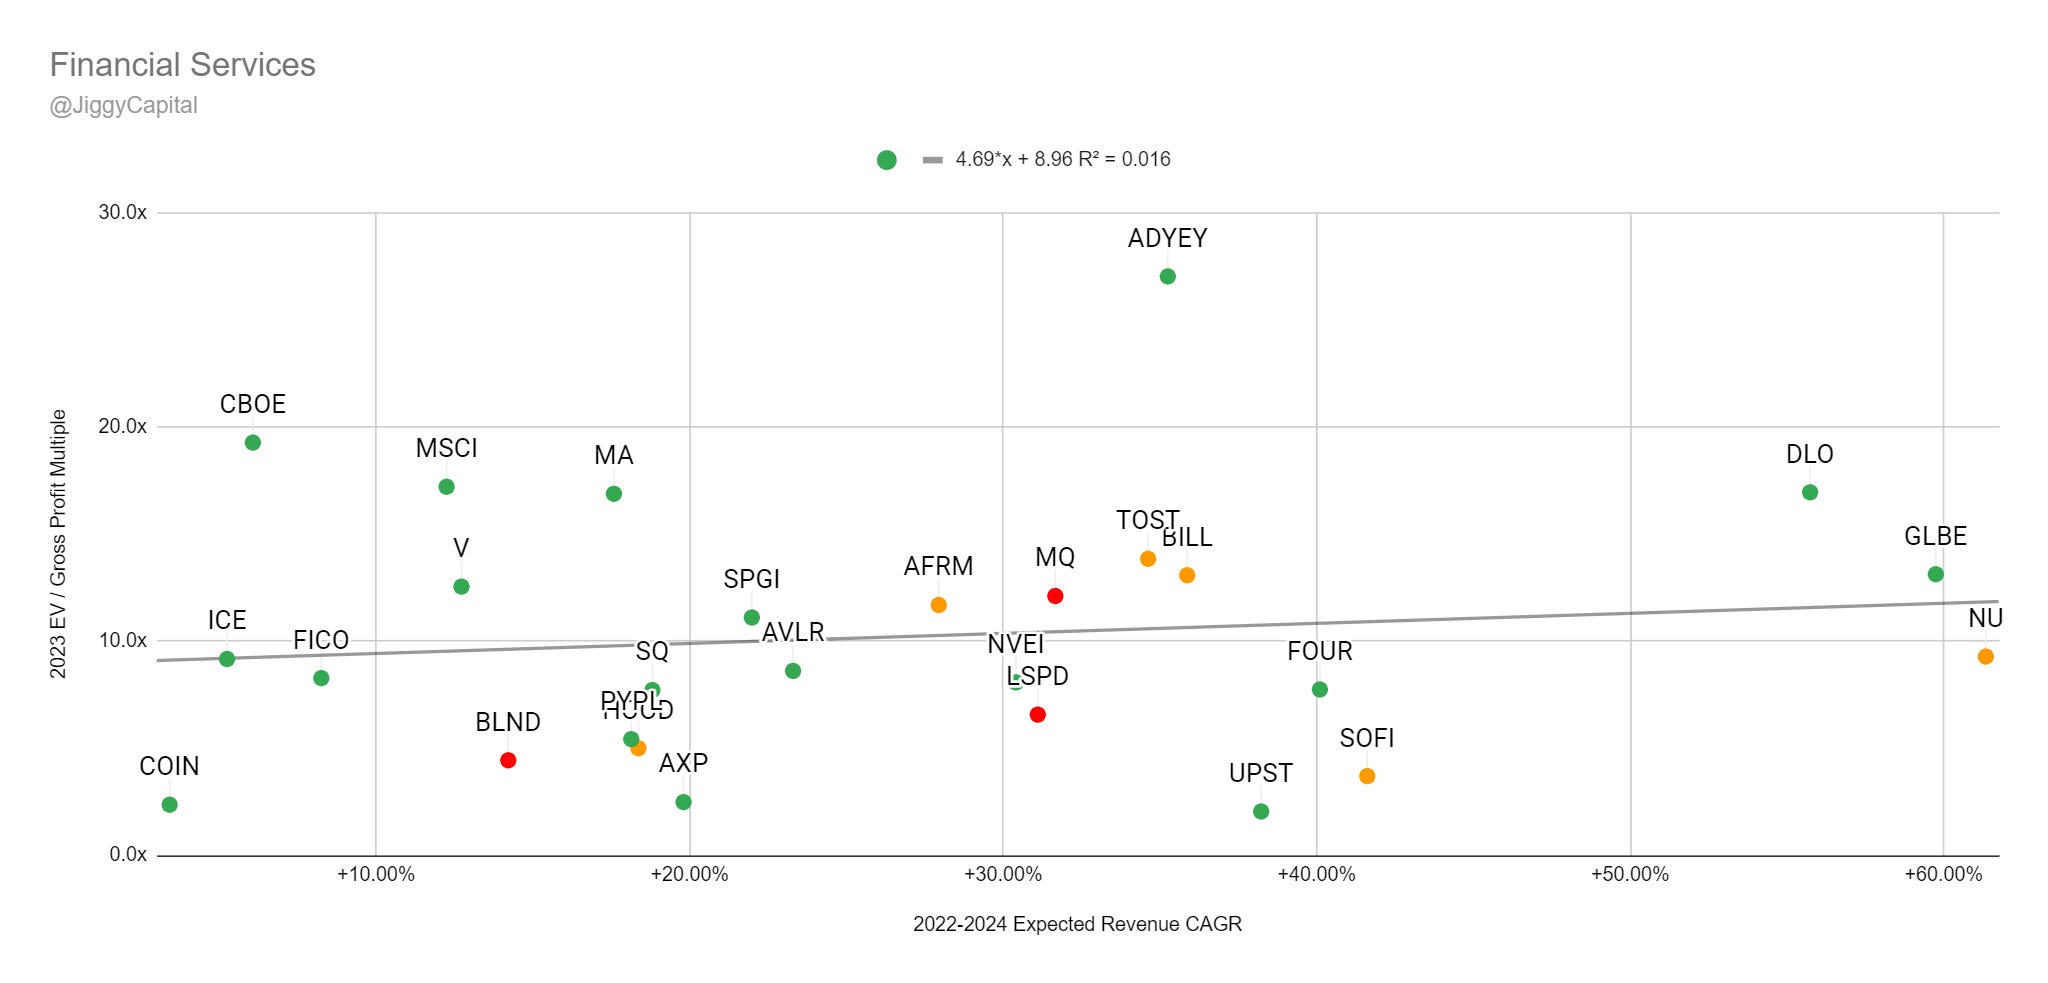
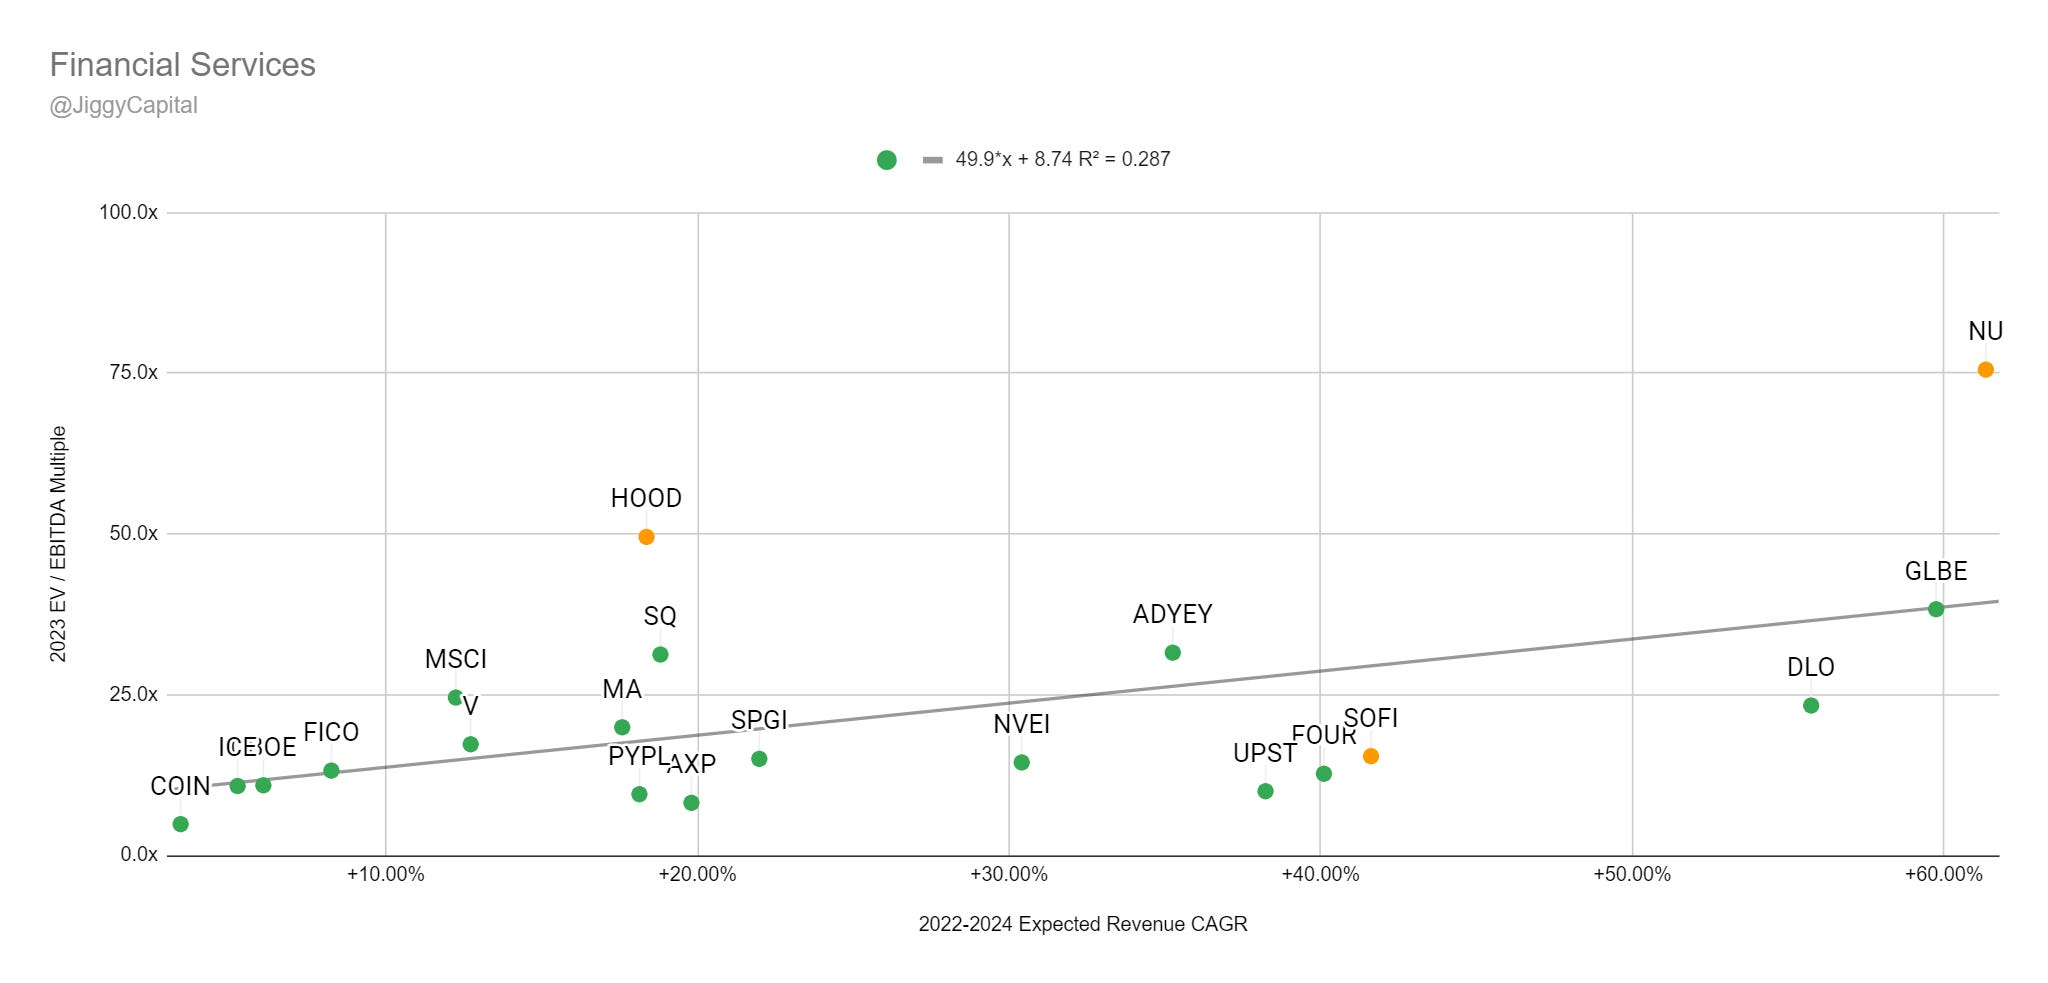
2022-2024 Revenue CAGR vs EV/2023 Gross Profit Multiple:
2022-2024 Revenue CAGR vs EV/2023 EBITDA Multiple:
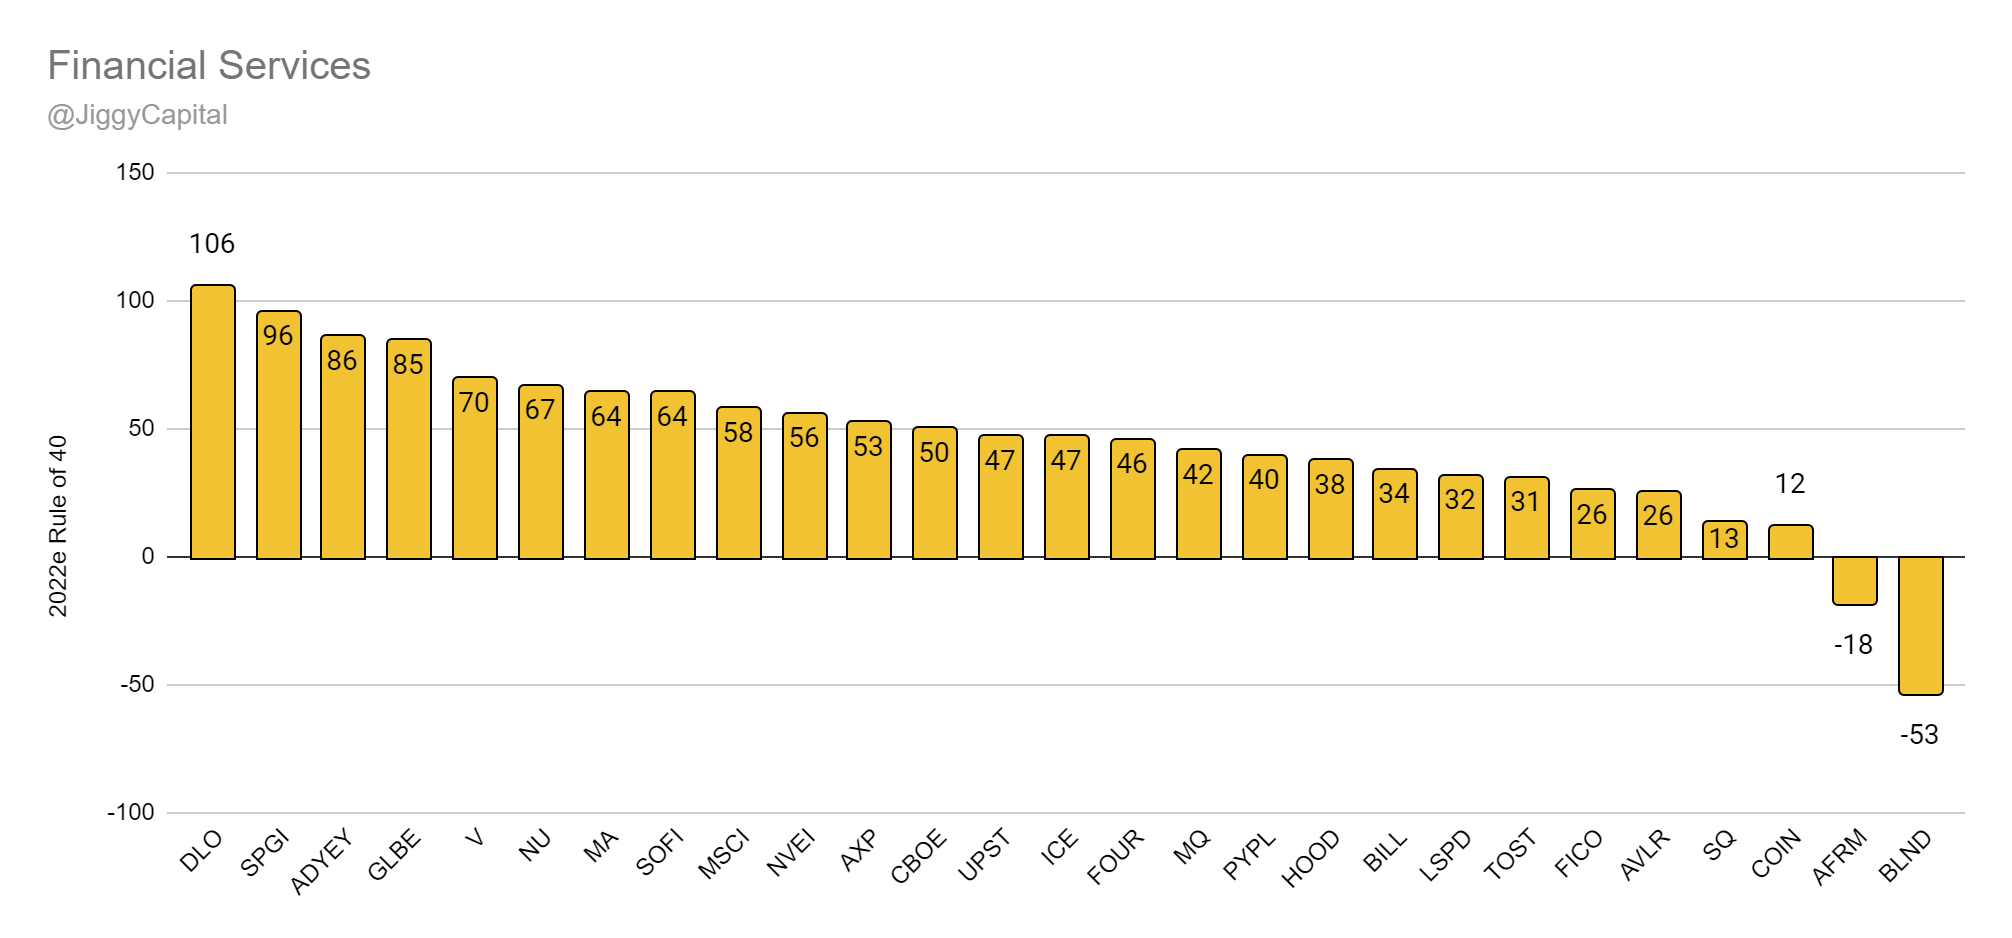
2022e Rule of 40 Scores:
Sector Stats:
Median Gross Margins: 65%
Median 2022e EBITDA Margin: 15%
Median 2022-2024 Projected Revenue CAGR: 26%
Median 2022e Rule of 40 Score: 47
Median 2022e FCF Yield %: 2.82%
Median EV/2023e GP Multiple: 9.0x
Median EV/2023e EBITDA Multiple: 15.5x
Sector Highlights:
Best Gross Margins: Visa — 97%
Best 2022e EBITDA Margins: Visa — 69%
Best 2022-2024 Projected Revenue CAGR: Nu — 61%
Best 2022e Rule of 40 Score: dLocal — 106
Best 2022e FCF Yield %: Coinbase — 9.48%
Worst Gross Margins: Toast — 19%
Worst 2022e EBITDA Margins: Blend Labs — -44%
Worst 2022-2024 Projected Revenue CAGR: Coinbase — 3%
Worst 2022e Rule of 40 Score: Blend Labs — -53
Worst 2022e FCF Yield %: Blend Labs — -15.89%
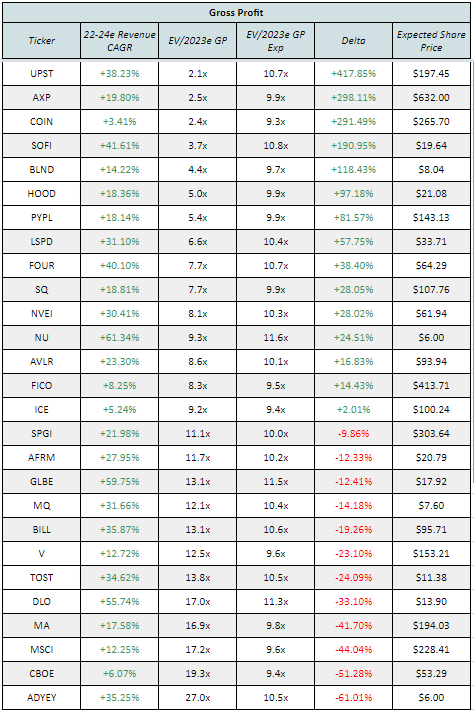
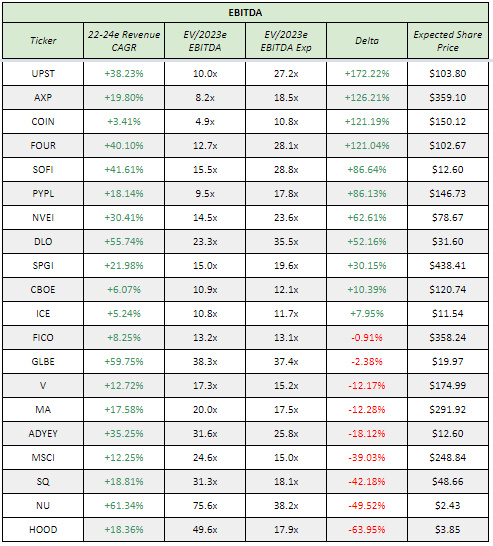
Scatter Plot Trendline Error Percentage:
“Undervalued”:
Gross Profit: Upstart (+417%)
EBITDA: Upstart (+172%)
“Overvalued”:
Gross Profit: Adyen (-61%)
EBITDA: Robinhood (-63%)
Full Data:
Gross Profit:
EBITDA:
My Take:
Visa and Mastercard financials just make my head explode every time I take a look. Msci and S&P Global financials also both stand out to as I’m not too familiar with either company.
It’s quite apparent the market isn’t very bullish on Upstarts future growth prospects heading into a more challenging lending macro environment given the disparity between growth and multiple attached compared to peers!
Infrastructure Software
Group (34): Akamai (AKAM), Couchbase (BASE), Confluent (CFLT), Crowdstrike (CRWD), Datadog (DDOG), DigitalOcean (DOCN), Dynatrace (DT), Elastic (ESTC), ForgeRock (FORG), JFrog (FROG), Fastly (FSLY), Alphabet (GOOG), Gitlab (GTLB), HashiCorp (HCP), Informatica (INFA), Samsara (IOT), MongoDB (MDB), Cloudflare (NET), New Relic (NEWR), Okta (OKTA), Palo Alto Networks (PANW), UiPath (PATH), PagerDuty (PD), Palantir (PLTR), Qualys (QLYS), Rapid7 (RPD), SentinelOne (S), Snowflake (SNOW), Splunk (SPLK), Teradata (TDC), Twilio (TWLO), Unity (U), Zscaler (ZS)
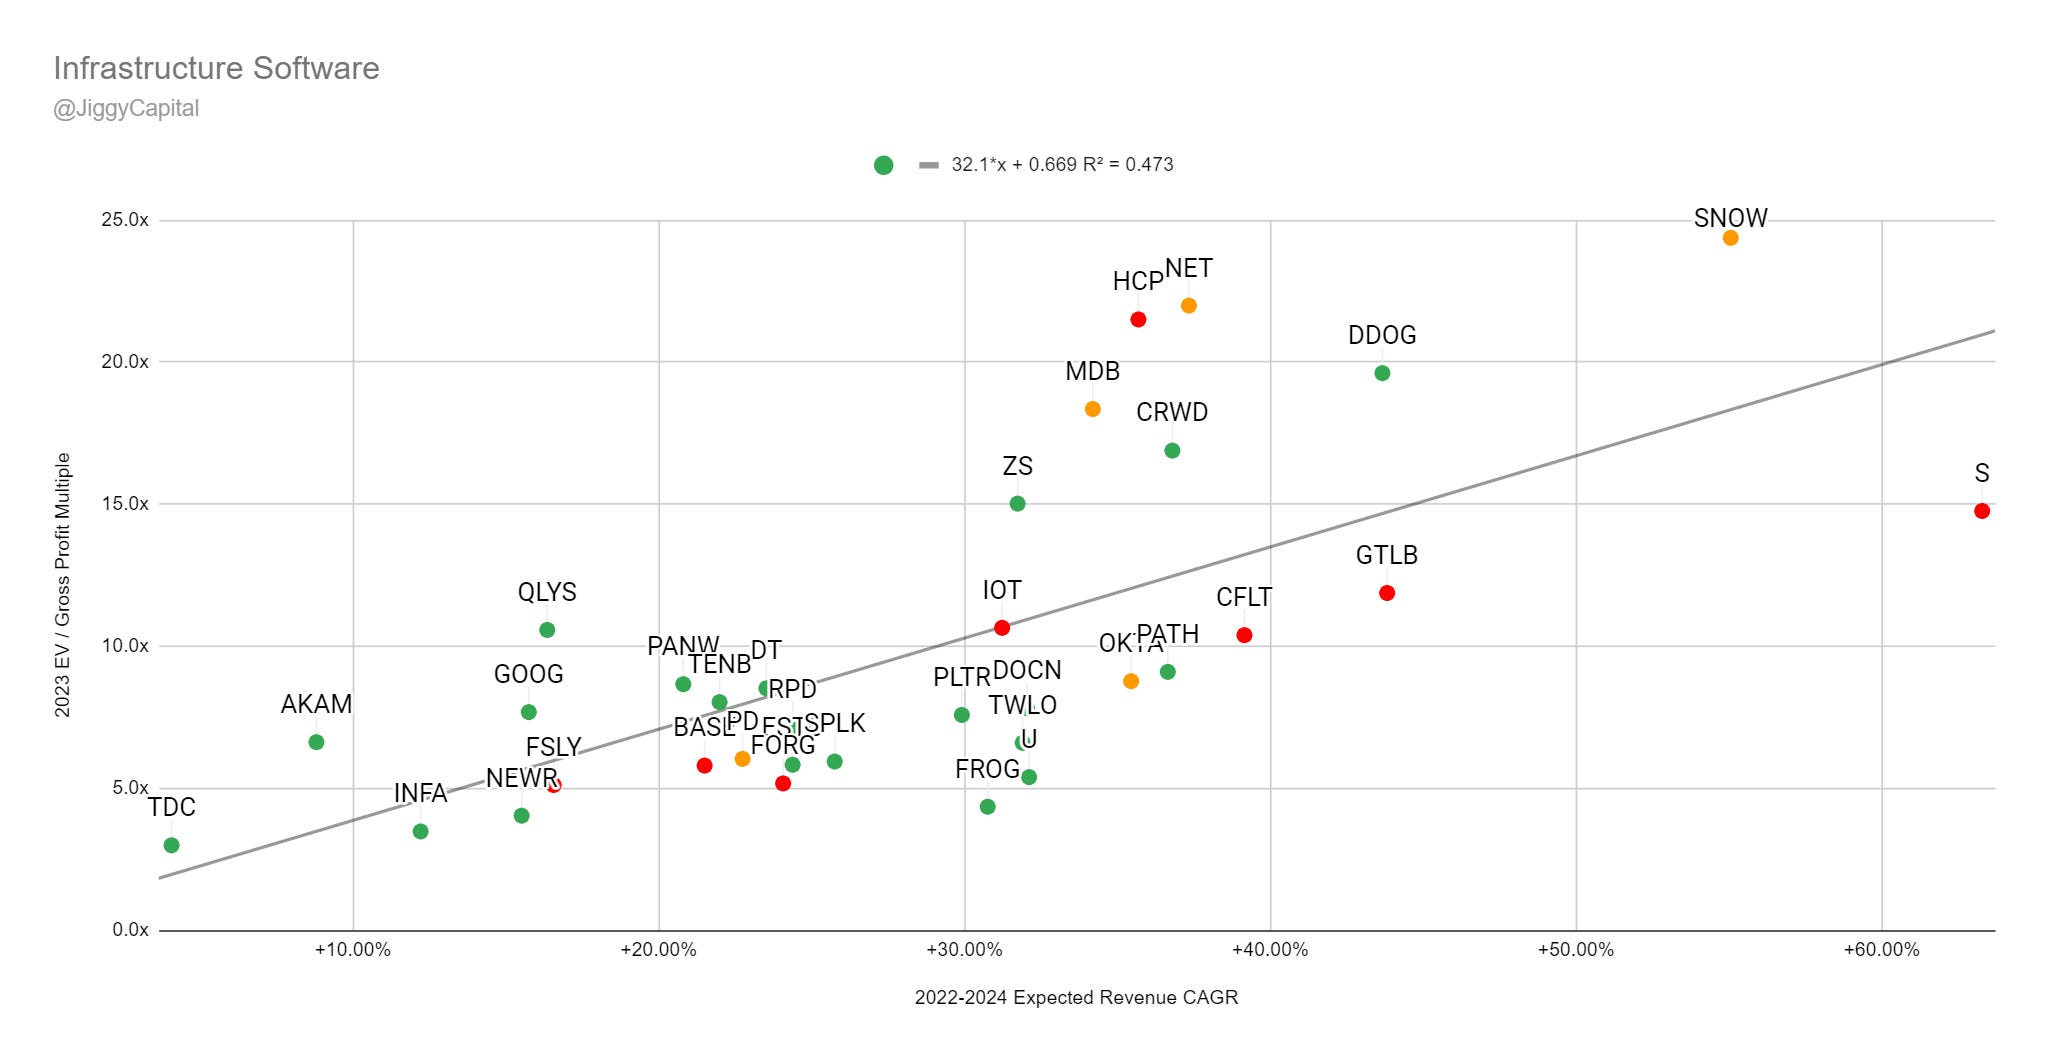
2022-2024 Revenue CAGR vs EV/2023 Gross Profit Multiple:
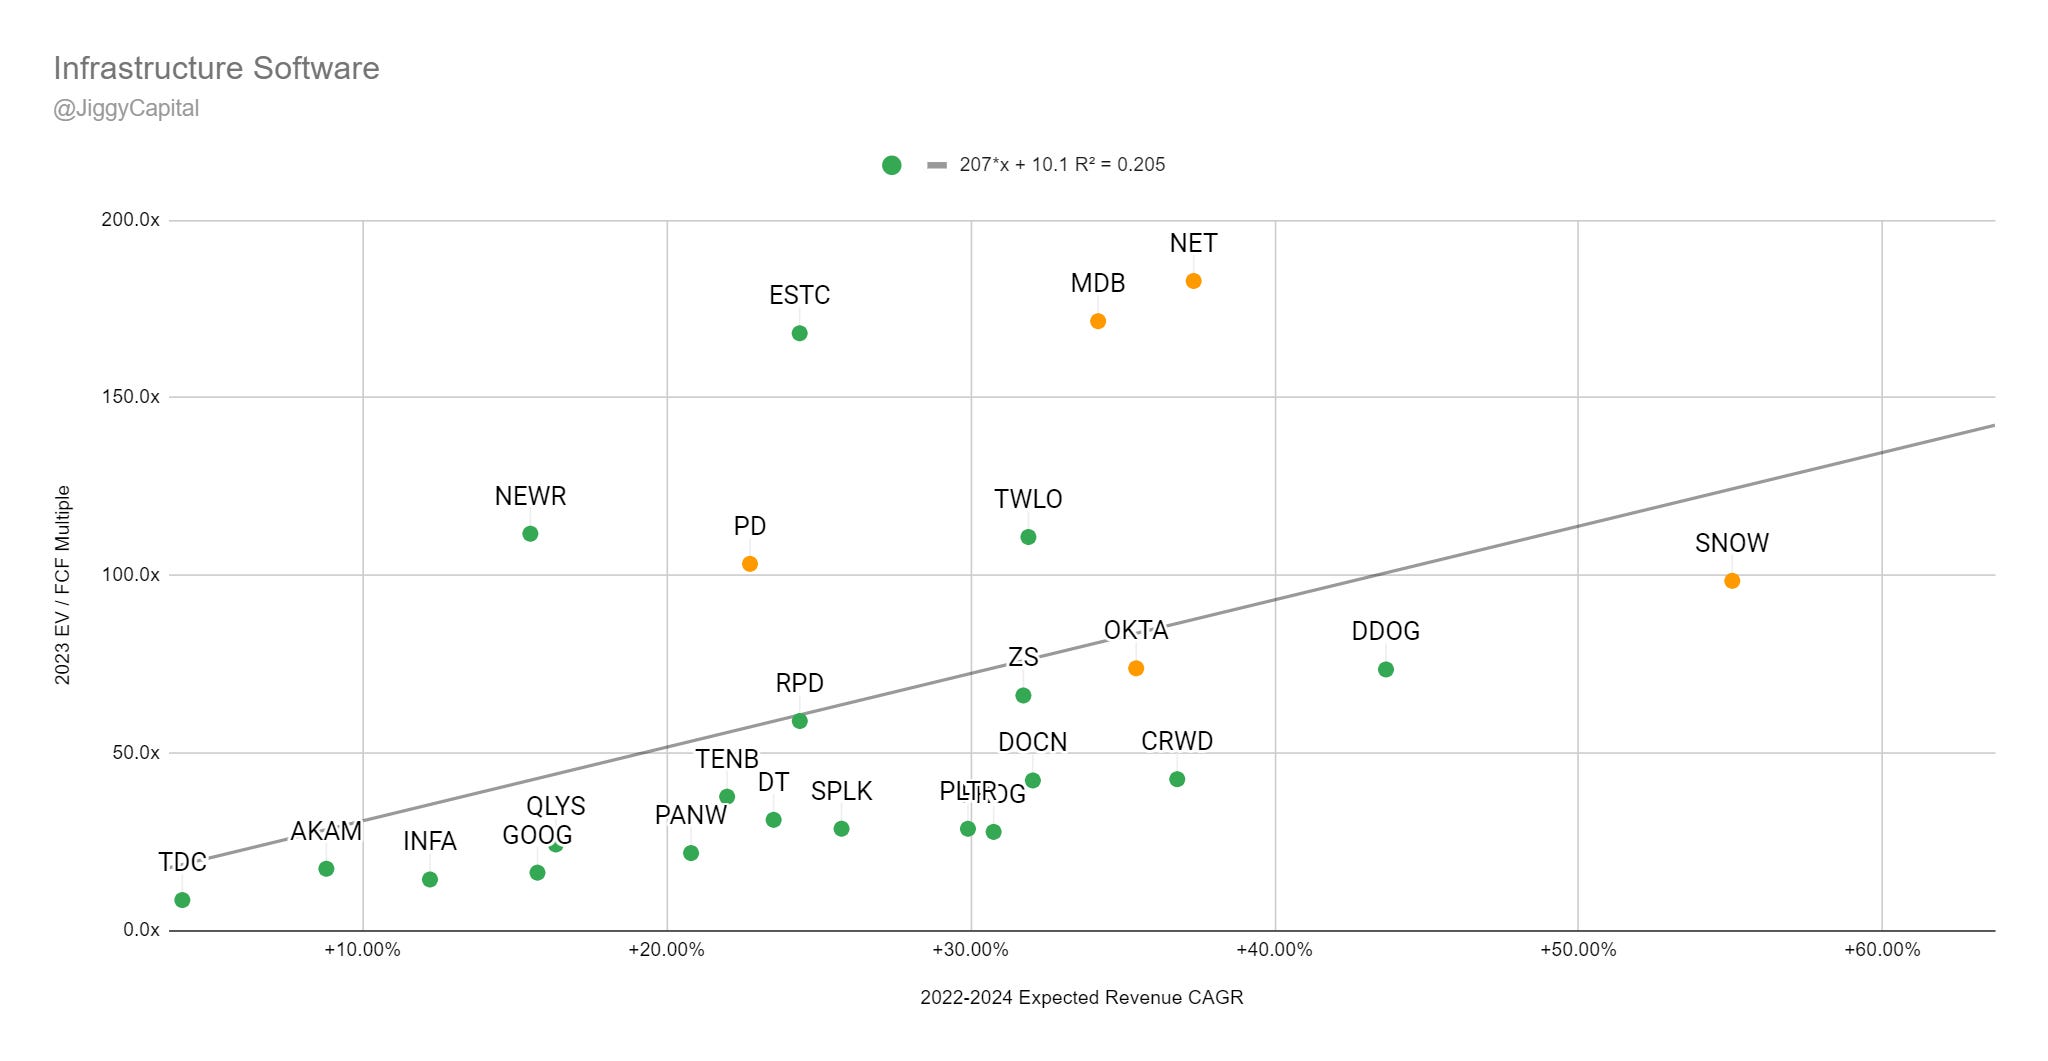
2022-2024 Revenue CAGR vs EV/2023 EBITDA Multiple:
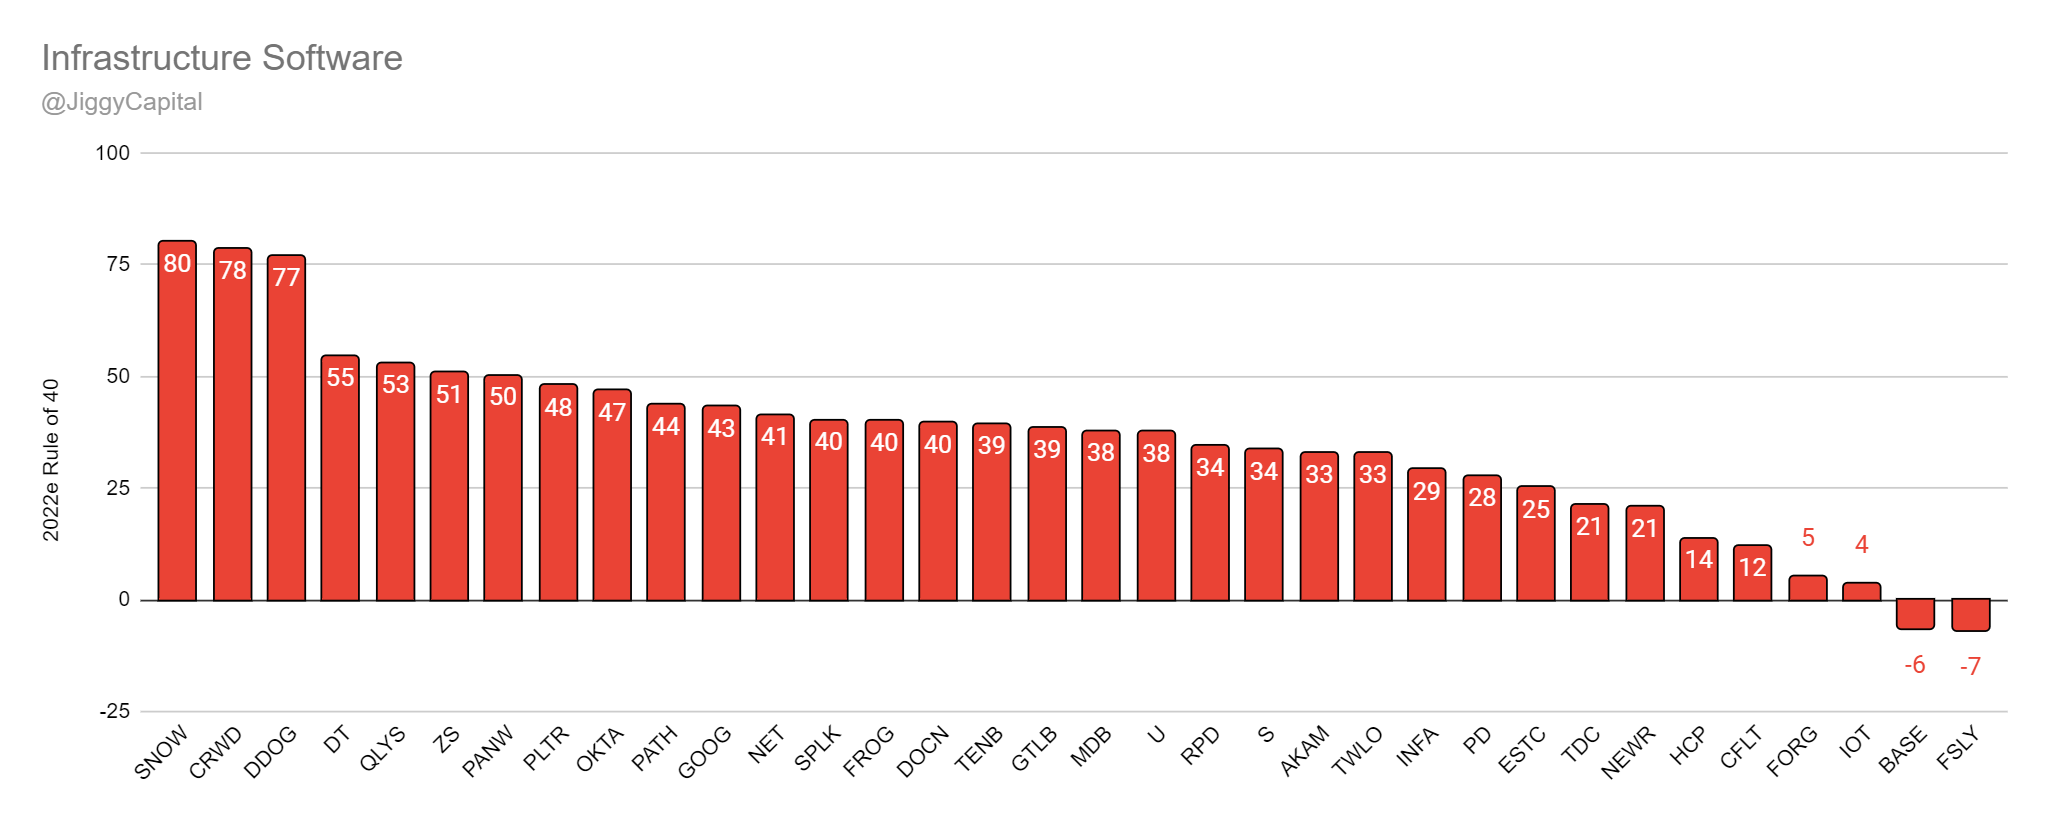
2022e Rule of 40 Scores:
Sector Stats:
Median Gross Margins: 74%
Median 2022e FCF Margin: 7%
Median 2022-2024 Projected Revenue CAGR: 30%
Median 2022e Rule of 40 Score: 38
Median 2022e FCF Yield %: 0.89%
Median EV/2023e GP Multiple: 7.9x
Median EV/2023e FCF Multiple: 42.4x
Sector Highlights:
Best Gross Margins: UiPath — 89%
Best 2022e FCF Margins: Qualys — 35%
Best 2022-2024 Projected Revenue CAGR: SentinelOne — 63%
Best 2022e Rule of 40 Score: Snowflake — 80
Best 2022e FCF Yield %: Teradata — 10.48%
Worst Gross Margins: Twilio — 49%
Worst 2022e FCF Margins: SentinelOne — -39%
Worst 2022-2024 Projected Revenue CAGR: Teradata — 4%
Worst 2022e Rule of 40 Score: (Fastly — -7
Worst 2022e FCF Yield %: Fastly — -6.73%
Scatter Plot Trendline Error Percentage:
“Undervalued”:
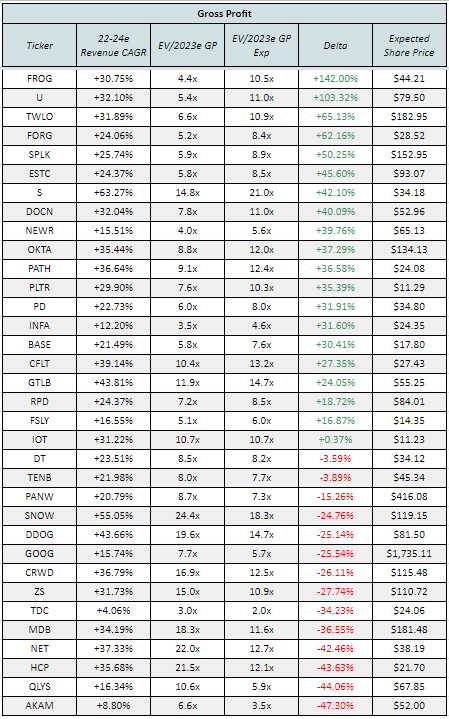
Gross Profit: JFrog (+142%)
FCF: Alphabet (+178%)
“Overvalued”:
Gross Profit: Akamai (-47%)
FCF: Elastic (-62%)
Full Data:
Gross Profit:
FCF:
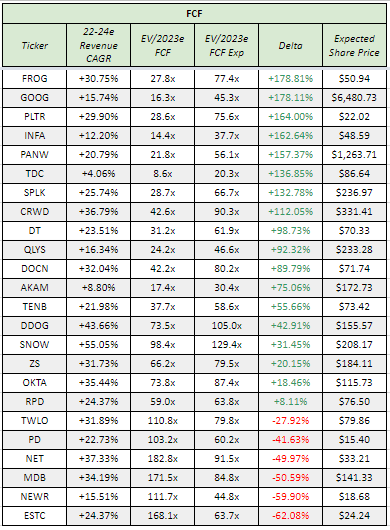
My Take:
JFrog has always seemed to trade at a discount to their growth which one has to think is due to their more niche product offering and future roadmap. It’s incredibly how much this groups valution has come down overall and could very well keep contracting. Hashicorp having a top tier GP multiple stood out to me.
Internet
Group (30): Apple (AAPL), Airbnb (ABNB), CarGurus (CARG), DoorDash (DASH), Disney (DIS), DraftKings (DKNG), Doximity (DOCS), Duolingo (DUOL), Evolution (EVVTY), Meta Platforms (FB), Fiverr (FVRR), Genius Sports (GENI), Alphabet (GOOG), Lemonade (LMND), Weedmaps (MAPS), MGM (MGM), Netflix (NFLX), Penn National (PENN), Pinterest (PINS), Roblox (RBLX), Roku (ROKU), Sea Ltd (SE), Snap (SNAP), Sportradar (SRAD), Trade Desk (TTD), Twitter (TWTR), Uber (UBER), Unity (U), Upwork (UPWK)
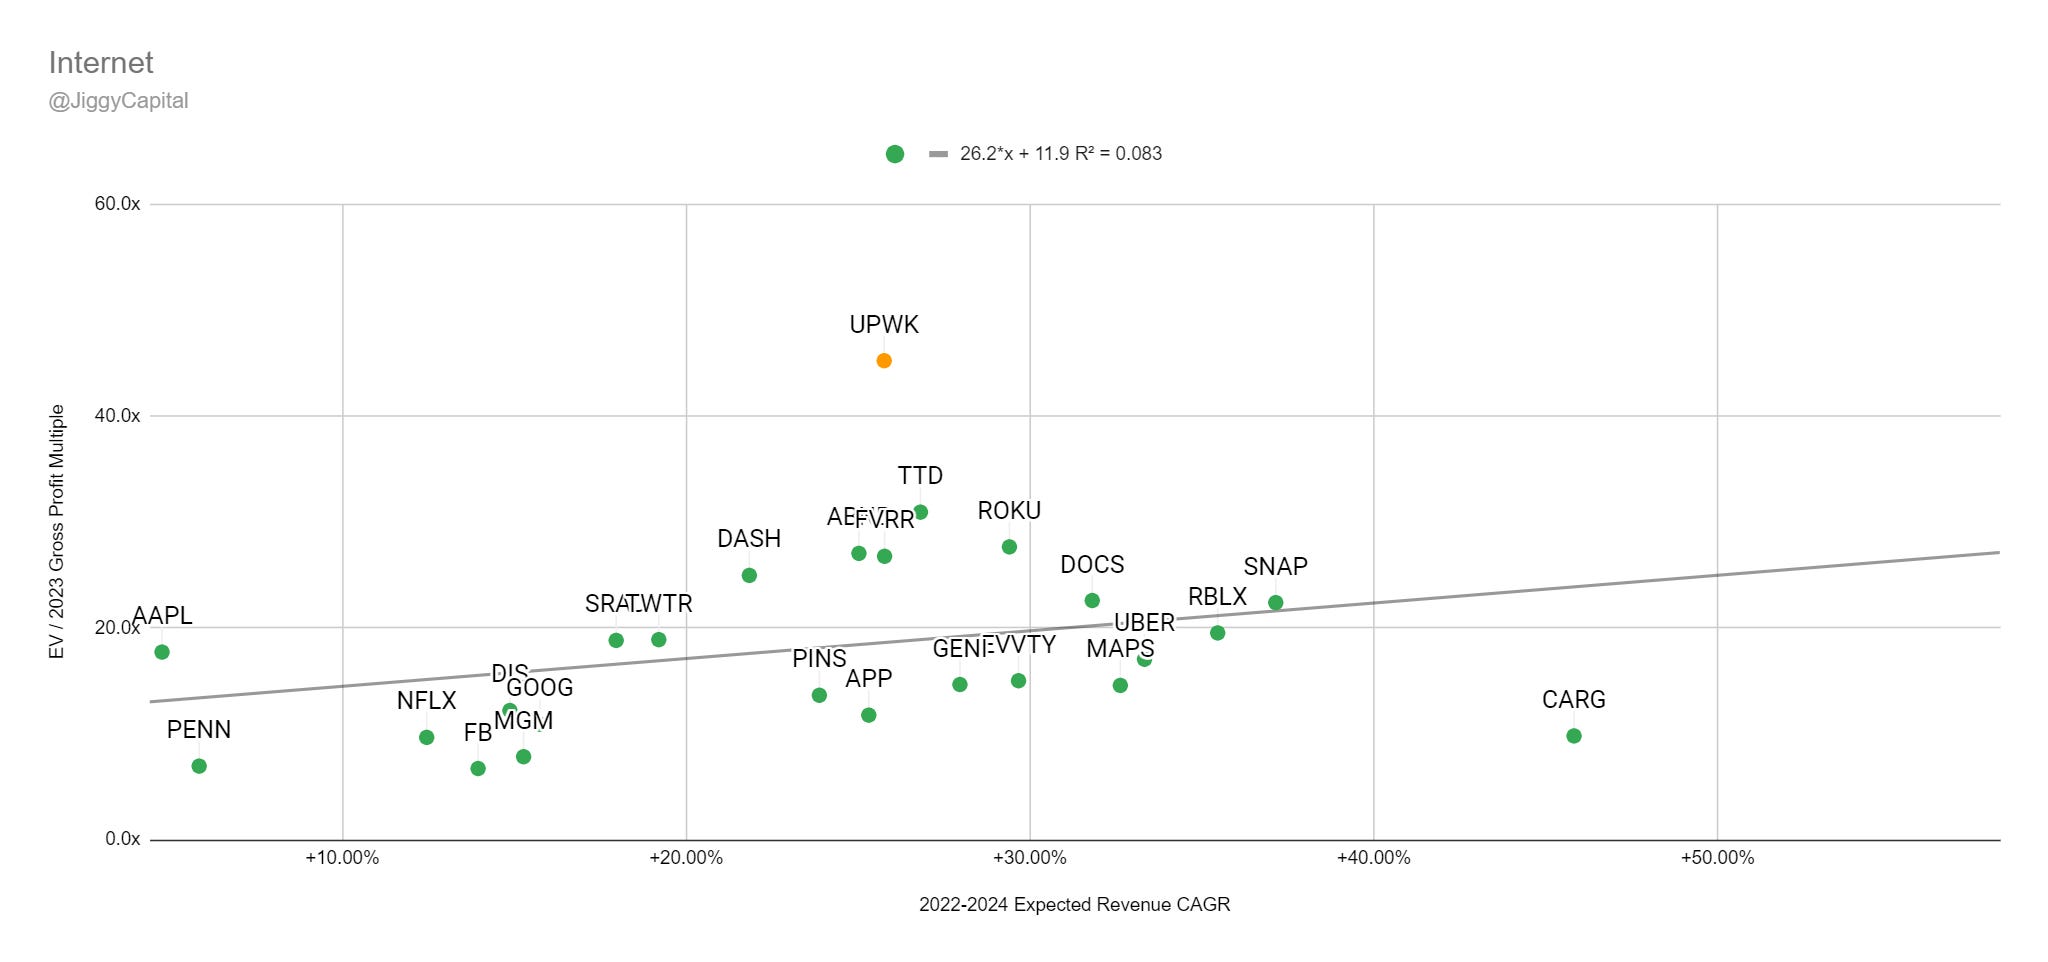
2022-2024 Revenue CAGR vs EV/2023 Gross Profit Multiple:
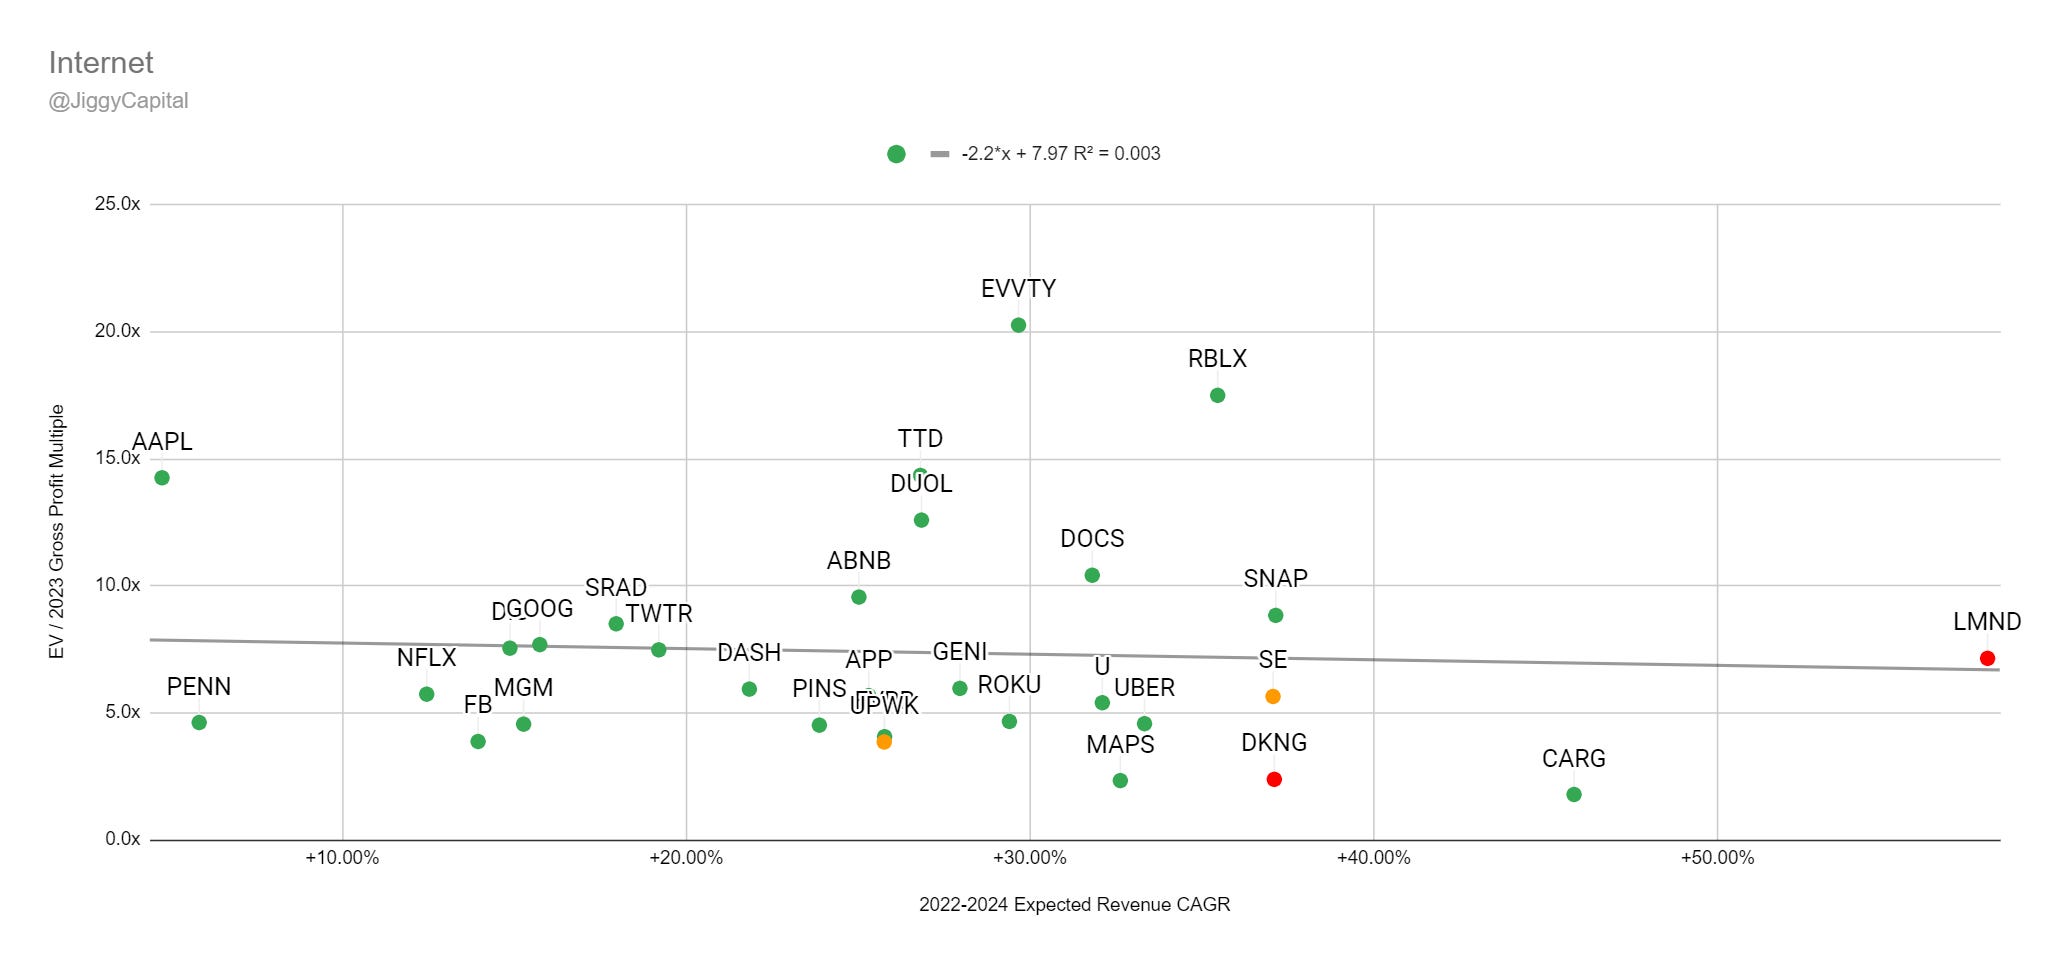
2022-2024 Revenue CAGR vs EV/2023 EBITDA Multiple:
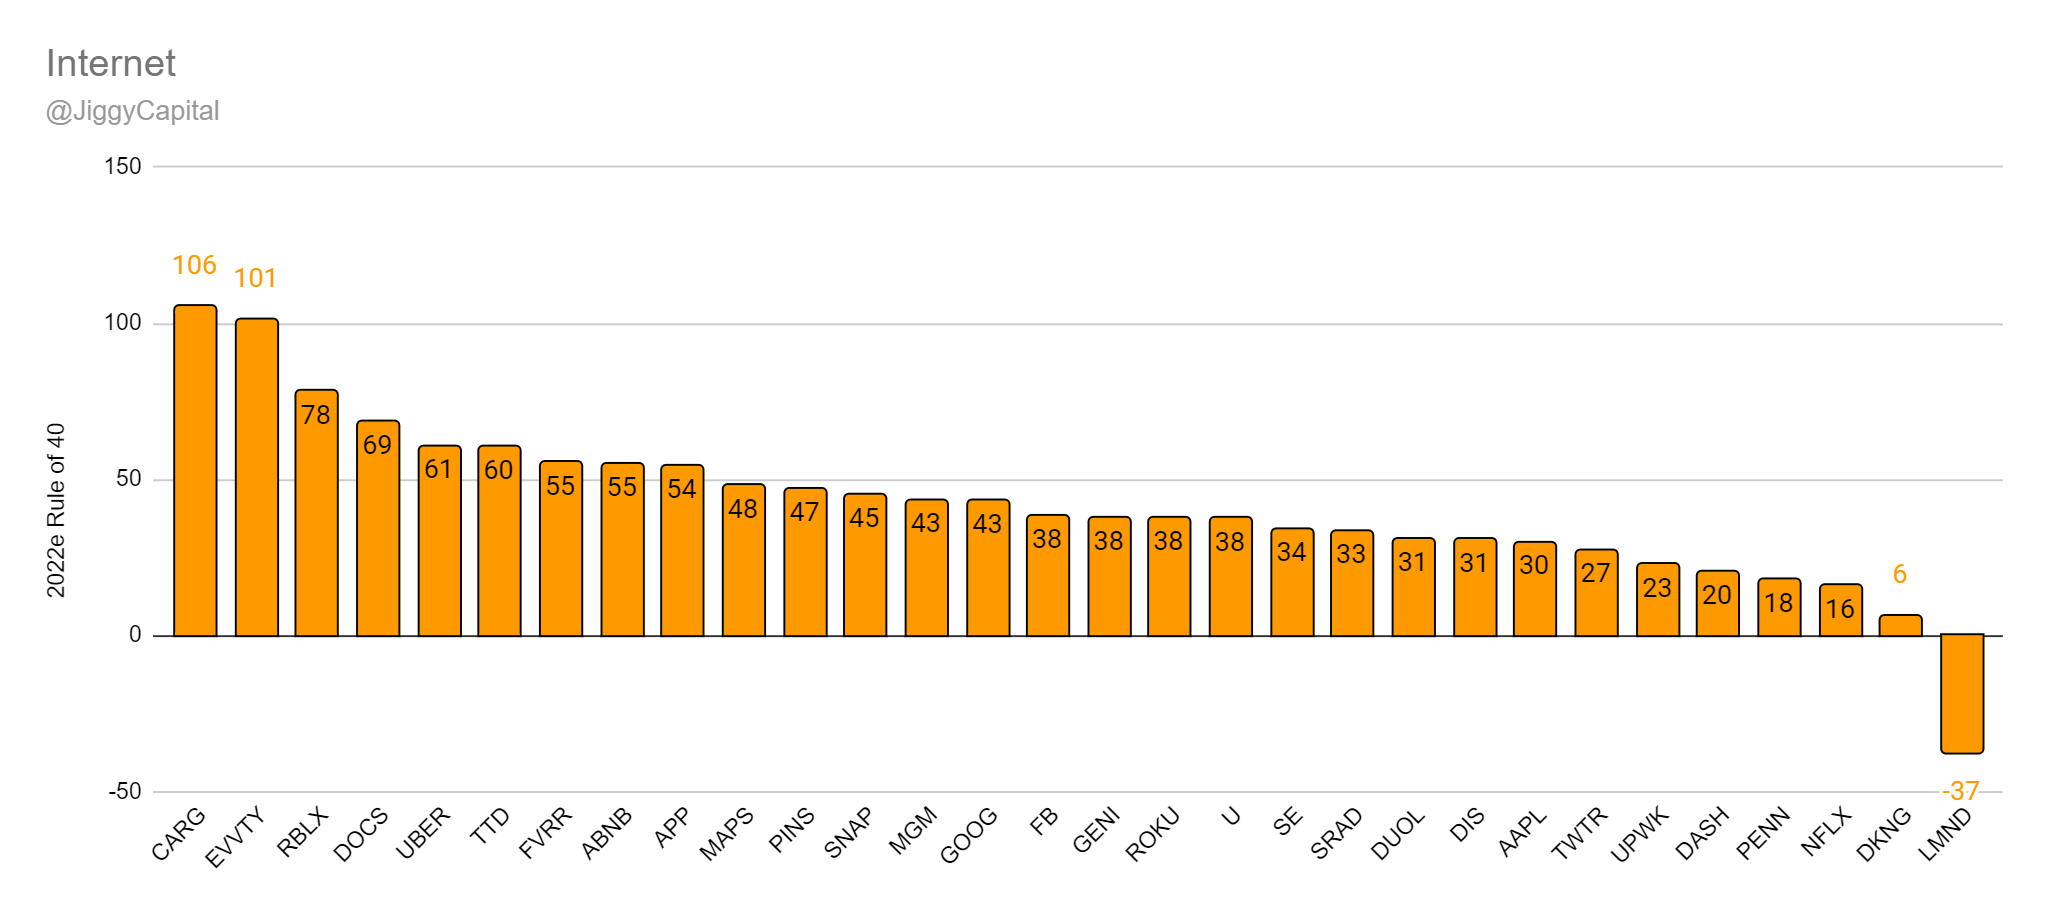
2022e Rule of 40 Scores:
Sector Stats:
Median Gross Margins: 55%
Median 2022e EBITDA Margin: 18%
Median 2022-2024 Projected Revenue CAGR: 26%
Median 2022e Rule of 40 Score: 38
Median 2022e FCF Yield %: 2.17%
Median EV/2023e GP Multiple: 5.8x
Median EV/2023e EBITDA Multiple: 17.1x
Sector Highlights:
Best Gross Margins: Weedmaps — 96%
Best 2022e EBITDA Margins: Evolution — 70%
Best 2022-2024 Projected Revenue CAGR: Lemonade — 57%
Best 2022e Rule of 40 Score: CarGurus — 106
Best 2022e FCF Yield %: CarGurus — 7.49%
Worst Gross Margins: Genius Sports — 24%
Worst 2022e EBITDA Margins: Lemonade — -127%
Worst 2022-2024 Projected Revenue CAGR: Apple — 5%
Worst 2022e Rule of 40 Score: Lemonade — -37
Worst 2022e FCF Yield %: Draftkings — -38.04%
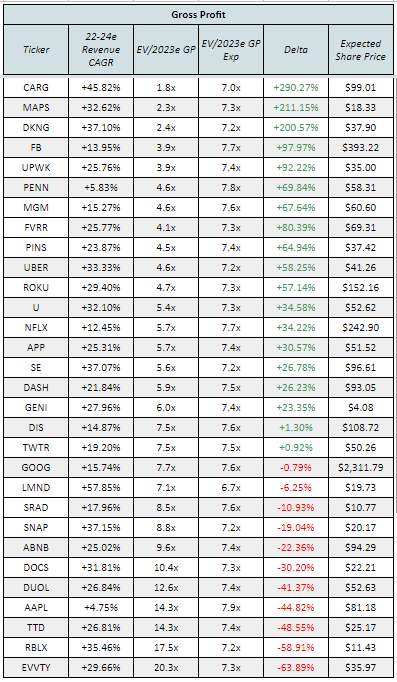
Scatter Plot Trendline Error Percentage:
“Undervalued”:
Gross Profit: CarGurus (+290%)
EBITDA: CarGurus (+143%)
“Overvalued”:
Gross Profit: Evolution (-63%)
EBITDA: Upwork (-59%)
Full Data:
Gross Profit:
EBITDA:
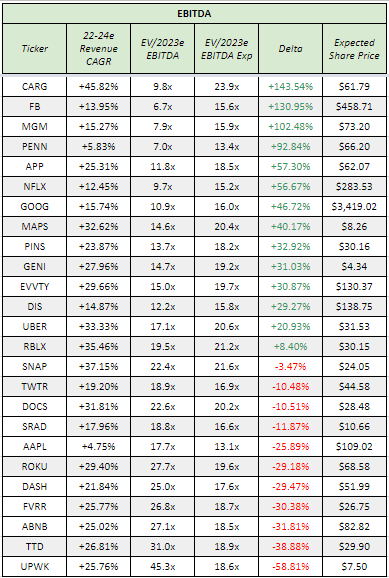
My Take:
I know literally not one thing about CarGurus but that they had a couple really impressive earnings reports and reactions over the last couple quarters. DraftKings FCF burn is genuinely really impressive…
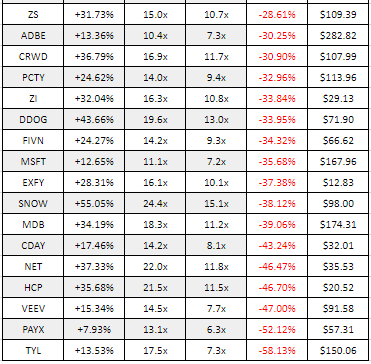
Semiconductors
Group (18): Analog Devices (ADI), Applied Materials (AMAT), Advanced Micro Devices (AMD), ASML (ASML), Broadcom (AVGO), Cadence Design Systems (CDNS), Globalfoundries (GFS), Intel (INTC), KLA Corp (KLAC), Lam Research (LRCX), Marvell (MRVL), Micron (MU), Nvidia (NVDA), NXP (NXPI), Qualcomm (QCOM), Synopsys (SNPS), Taiwan Semiconductor (TSM), Texas Instruments (TXN)
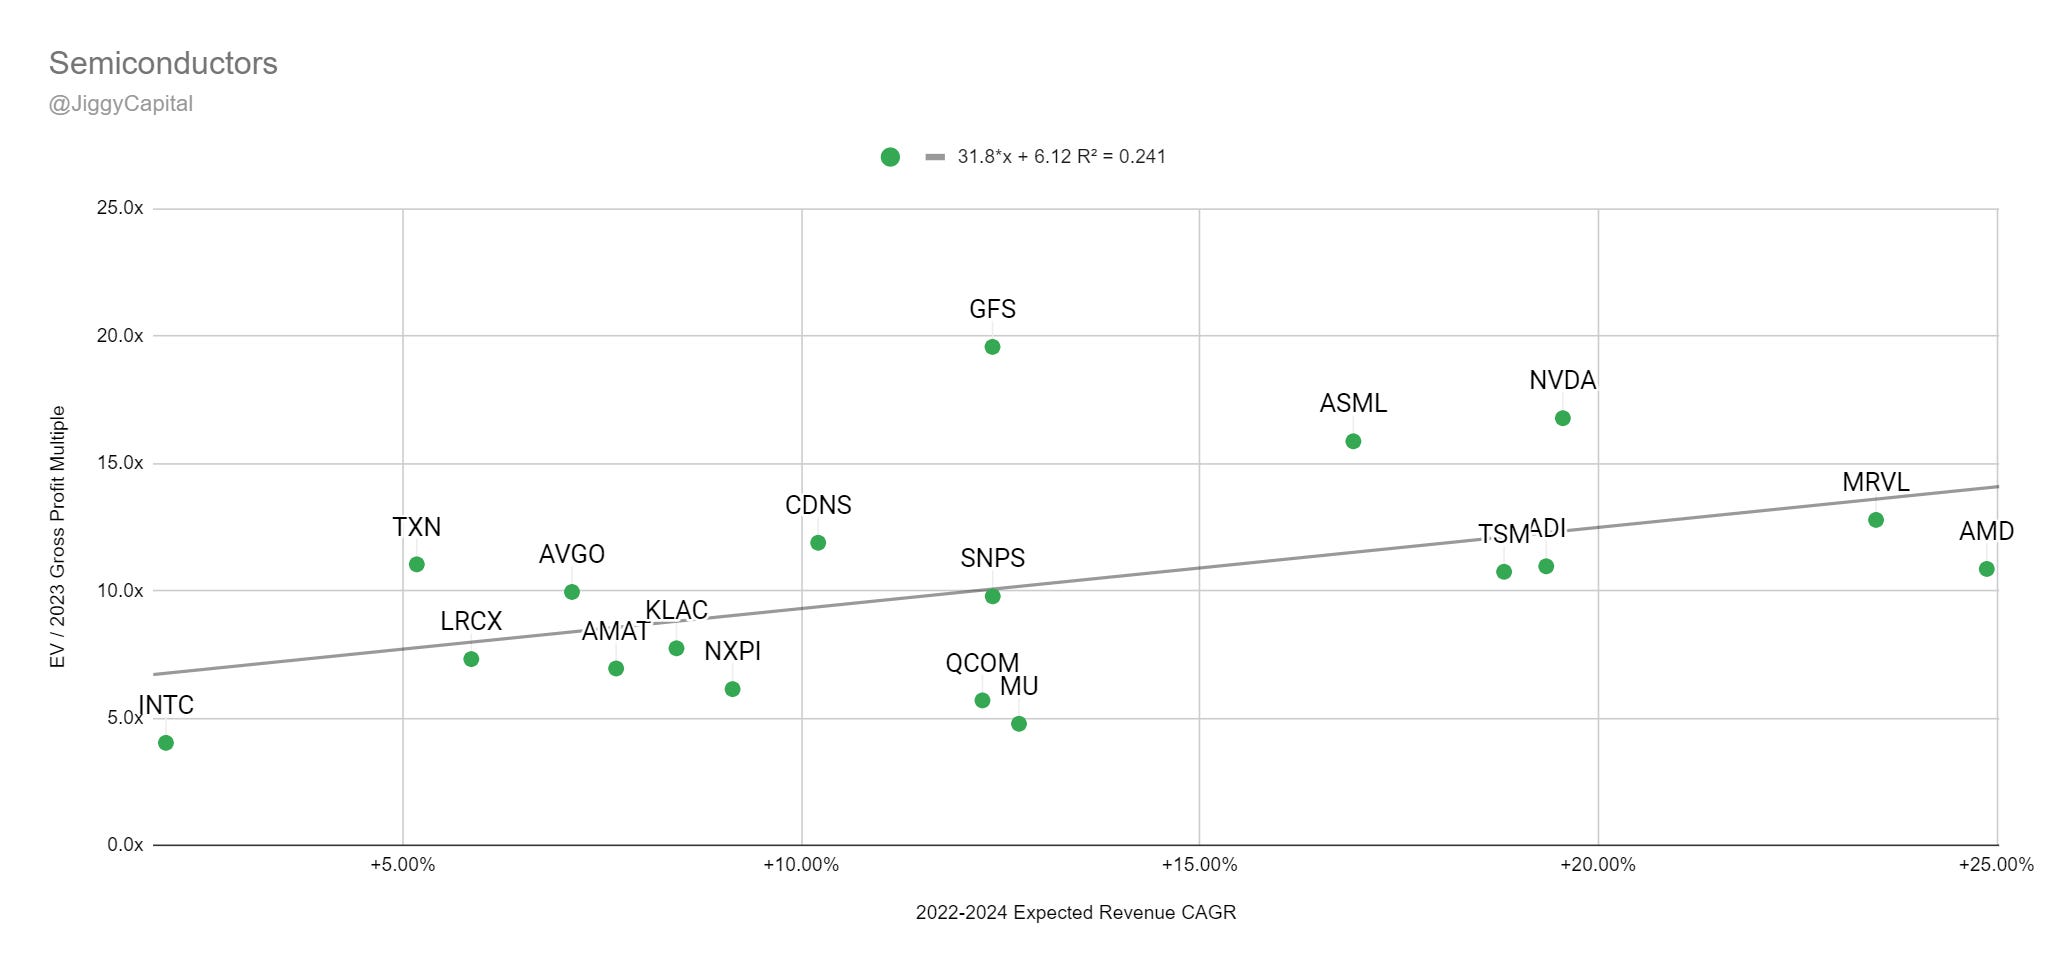
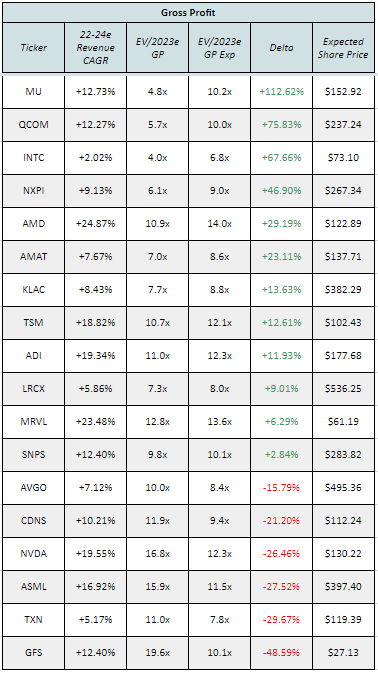
2022-2024 Revenue CAGR vs EV/2023 Gross Profit Multiple:
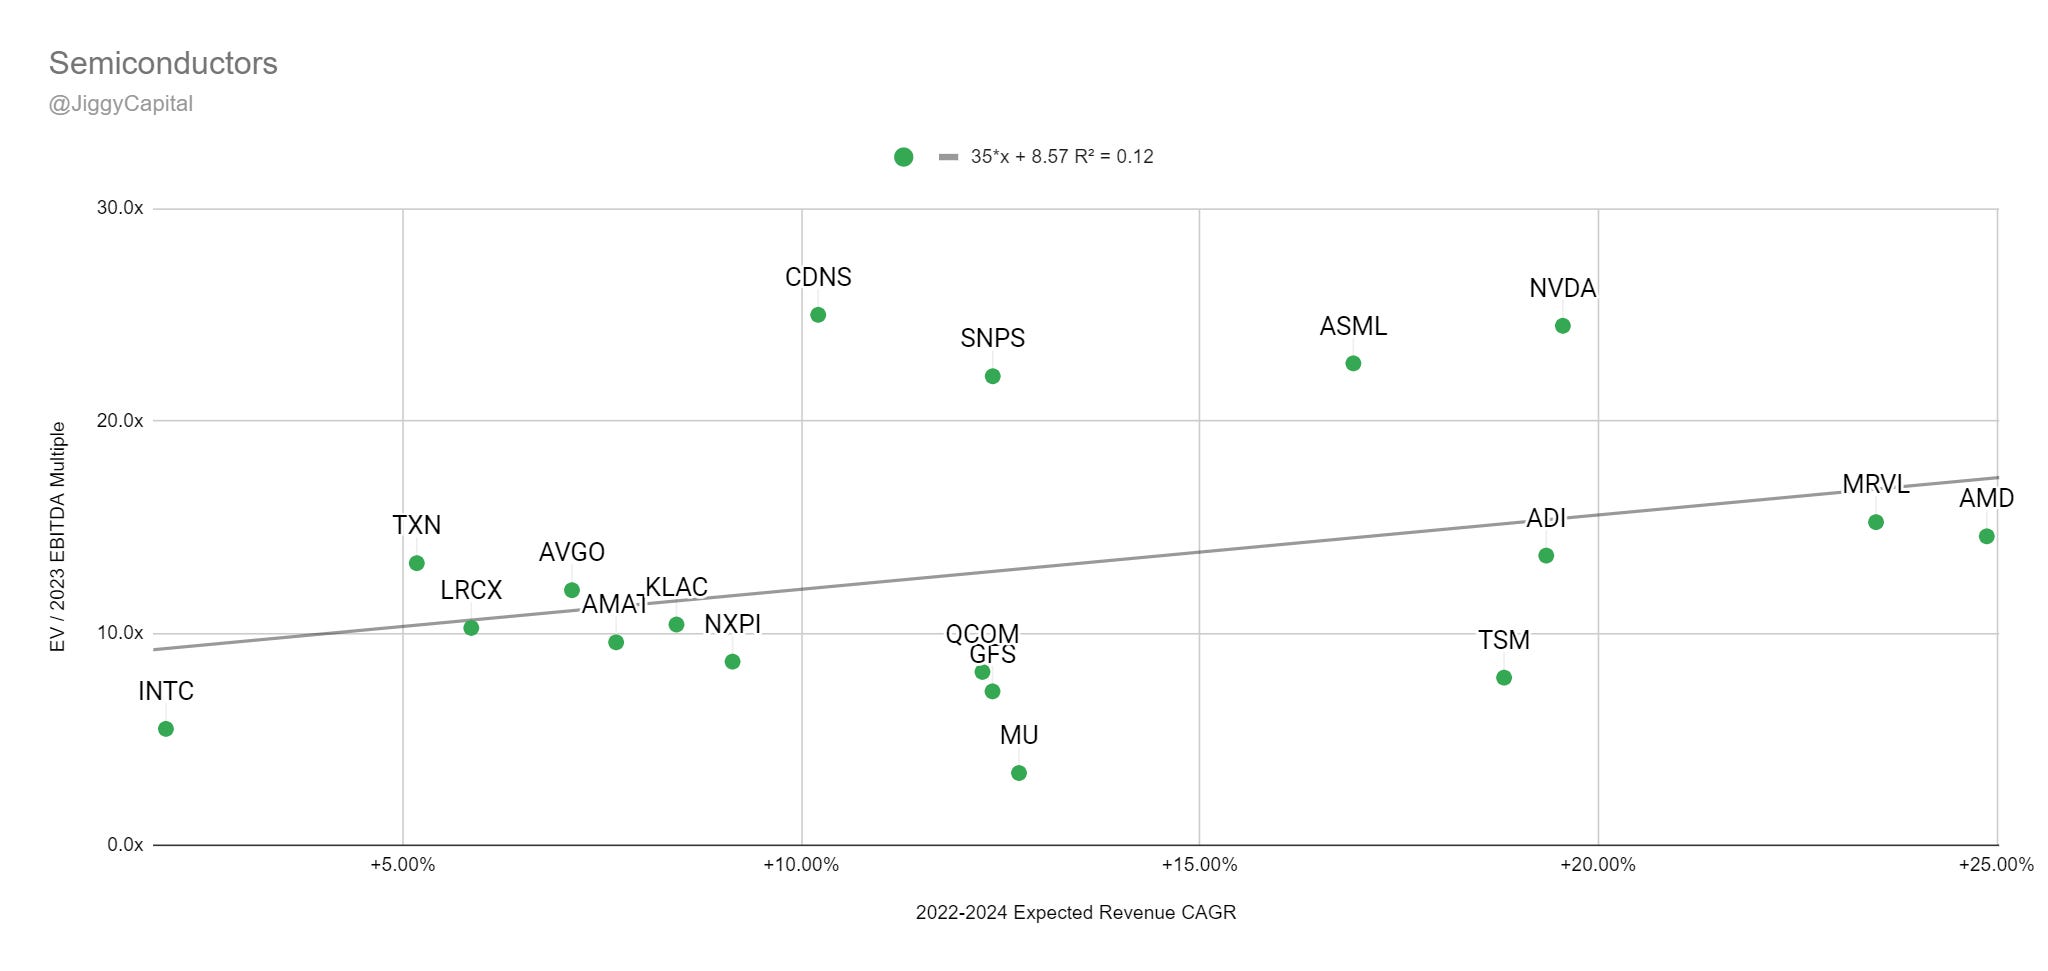
2022-2024 Revenue CAGR vs EV/2023 EBITDA Multiple:
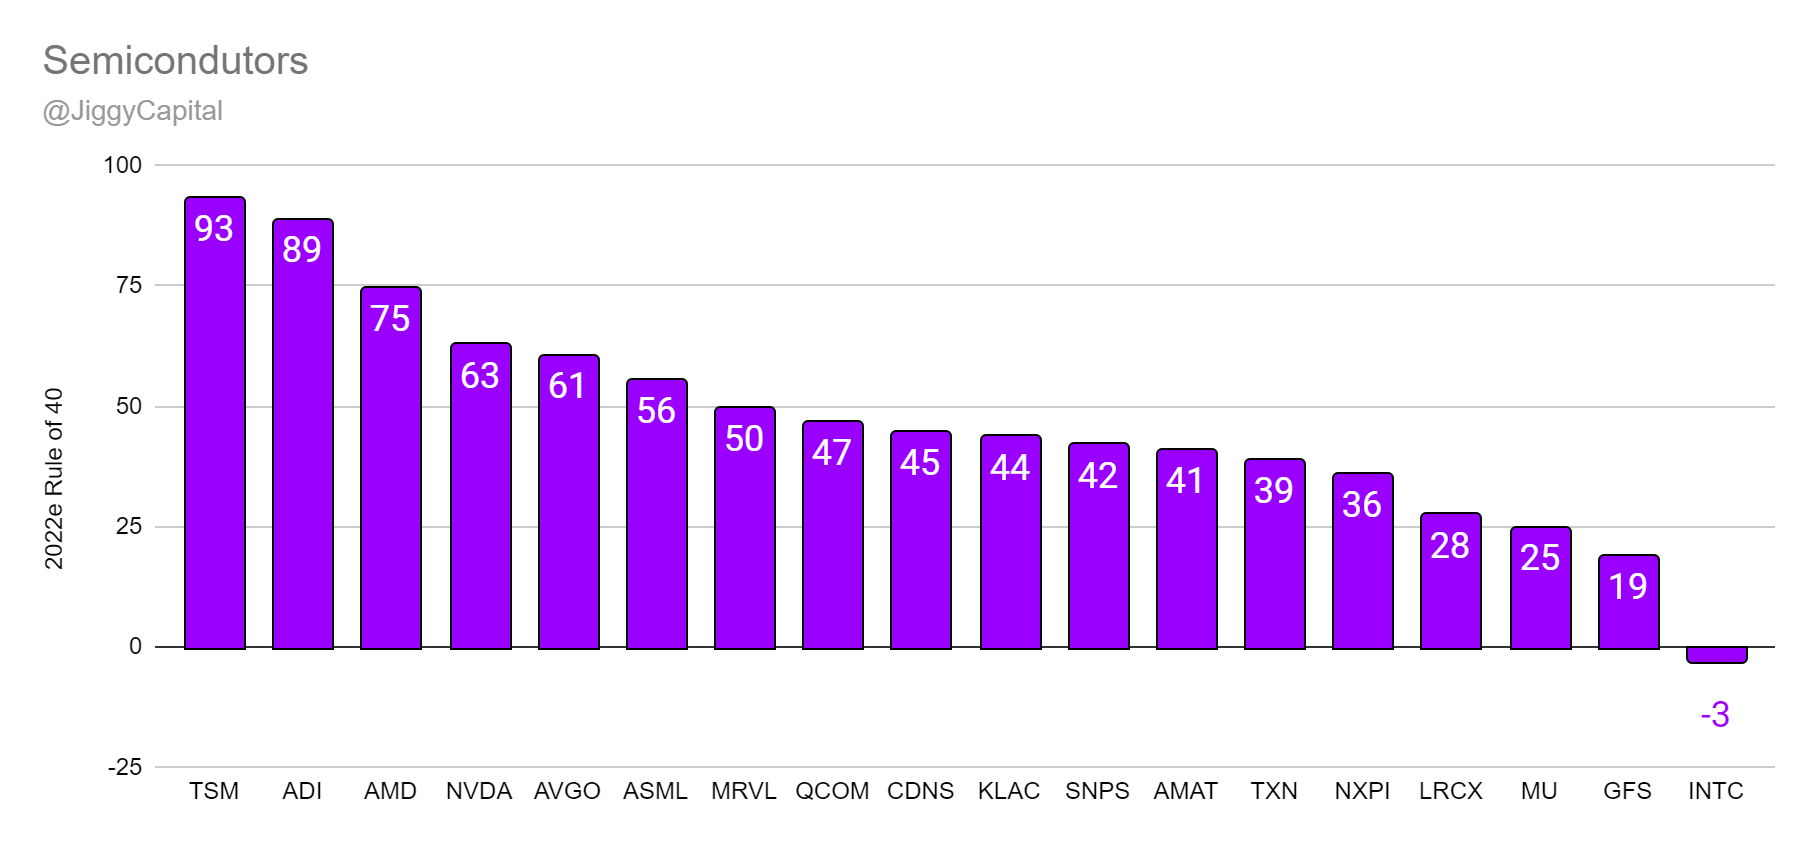
2022e Rule of 40 Scores:
Sector Stats:
Median Gross Margins: 55%
Median 2022e EBITDA Margin: 42%
Median 2022-2024 Projected Revenue CAGR: 12%
Median 2022e Rule of 40 Score: 44
Median 2022e FCF Yield %: 4.38%
Median EV/2023e GP Multiple: 10.4x
Median EV/2023e EBITDA Multiple: 11.2x
Sector Highlights:
Best Gross Margins: Cadence Design Systems — 90%
Best 2022e EBITDA Margins: Taiwan Semiconductor — 68%
Best 2022-2024 Projected Revenue CAGR: AMD — 25%
Best 2022e Rule of 40 Score: Taiwan Semiconductor — 93
Best 2022e FCF Yield %: Taiwan Semiconductor — 10.94%
Worst Gross Margins: Globalfoundries — 15%
Worst 2022e EBITDA Margins: AMD — 33%
Worst 2022-2024 Projected Revenue CAGR: Intel — 2%
Worst 2022e Rule of 40 Score: Intel — -3
Worst 2022e FCF Yield %: Marvell — 1.63%
Scatter Plot Trendline Error Percentage:
“Undervalued”:
Gross Profit: Micron (+112%)
EBITDA: Micron (+280%)
“Overvalued”:
Gross Profit: Globalfoundries (-46%)
EBITDA: Cadence Design Systems (-52%)
Full Data:
Gross Profit:
EBITDA:
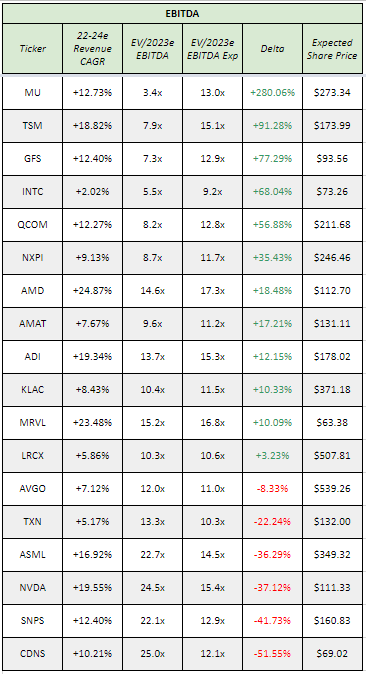
My Take:
Isn’t it just incredibly how the lowest 2022 EBITDA margin out of this group is at 33%?! But overall it stands out to me how Micron’s multiple and growth don’t matchup for both GP and EBITDA multiples.
Not surprising that the EDA and fabless players have higher multiples than the foundries as well, not a perfect look grouping these all together no doubt!
Software
Group (77): Adobe (ADBE), Autodesk (ADSK), Akamai (AKAM), Amplitude (AMPL), Asana (ASAN), Couchbase (BASE), Bigcommerce (BIGC), Bill.com (BILL), Blackline (BL), Braze (BRZE), Ceridian (CDAY), Confluent (CFLT), Coupa (COUP), Salesforce (CRM), Crowdstrike (CRWD), Sprinklr (CXM), Datadog (DDOG), DigitalOcean (DOCN), DocuSign (DOCU), Dynatrace (DT), Elastic (ESTC), Expensify (EXFY), Five9 (FIVN), ForgeRock (FORG), JFrog (FROG), Freshworks (FRSH), Fastly (FSLY), Alphabet (GOOG), Gitlab (GTLB), Hashicorp (HCP), HubSpot (HUBS), Informatica (INFA), Intuit (INTU), Samsara (IOT), Lightspeed (LSPD), MongoDB (MDB), Monday.com (MNDY), Microsoft (MSFT), Cloudflare (NET), New Relic (NEWR), Nice (NICE), ServiceNow (NOW), Okta (OKTA), Olo (OLO), Oracle (ORCL), Palo Alto Networks (PANW), UiPath (PATH), Paycom (PAYC), Paychex (PAYX), Procore (PCOR), Paylocity (PCTY), Pagerduty (PD), Palantir (PLTR), Powerschool (PWSC), Qualys (QYLS), RingCentral (RNG), Rapid7 (RPD), SentinelOne (S), Semrush (SEMR), Shopify (SHOP), Smartsheet (SMAR), Snowflake (SNOW), Splunk (SPLK), Sprout Social (SPT), Squarespace (SQSP), Teradata (TDC), Atlassian (TEAM), Tenable (TENB), Twilio (TWLO), Tyler Technologies (TYL), Unity (U), Veeva (VEEV), Workday (WDAY), Zendesk (ZEN), ZoomInfo (ZI), Zoom Video (ZM), Zscaler (ZS)
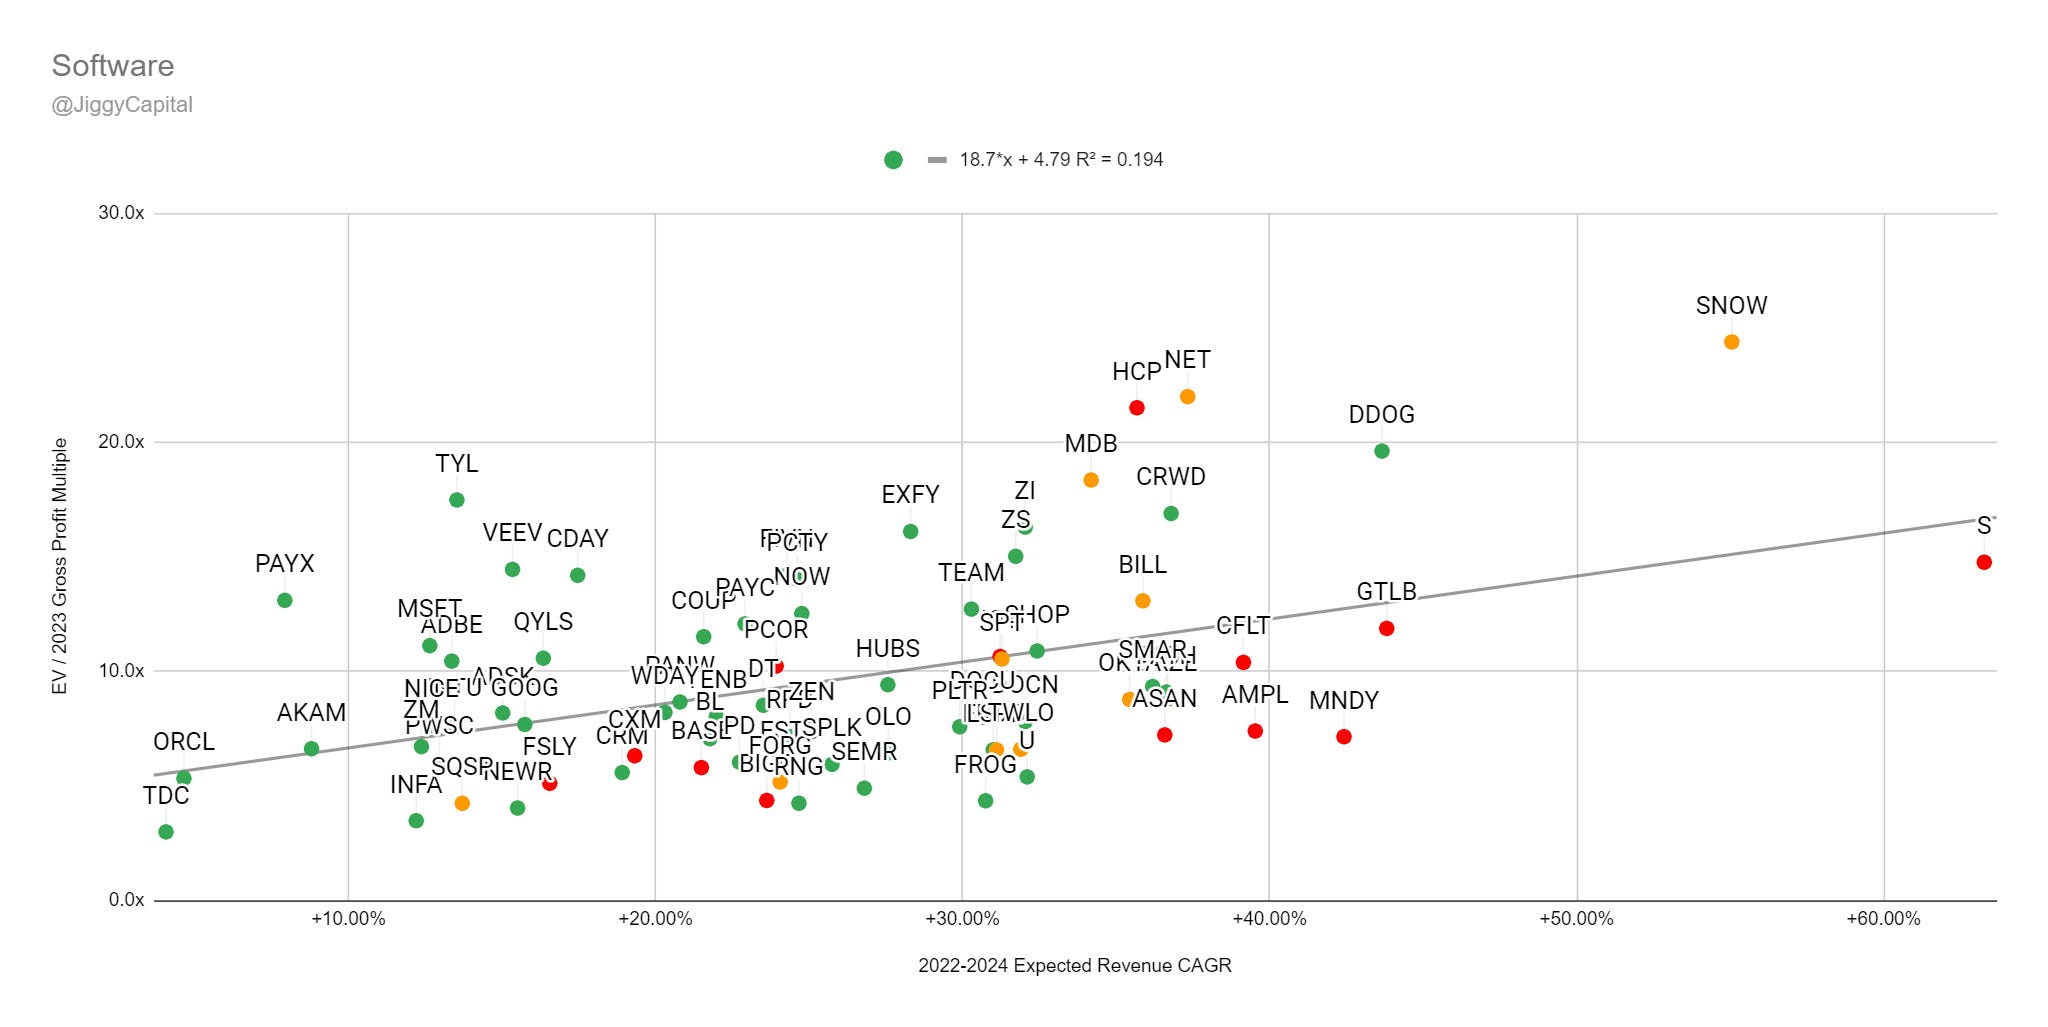
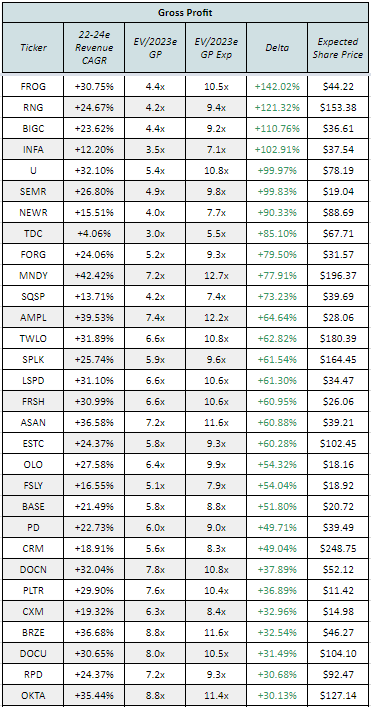
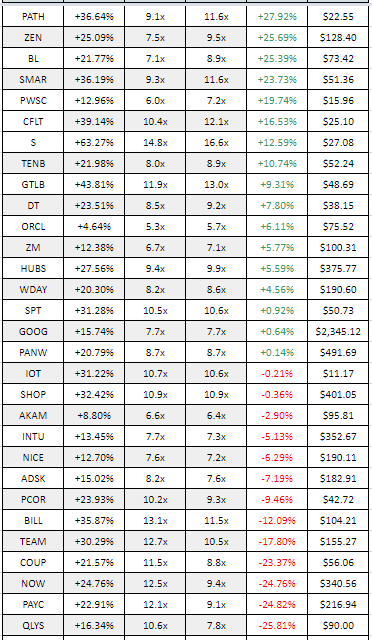
2022-2024 Revenue CAGR vs EV/2023 Gross Profit Multiple:
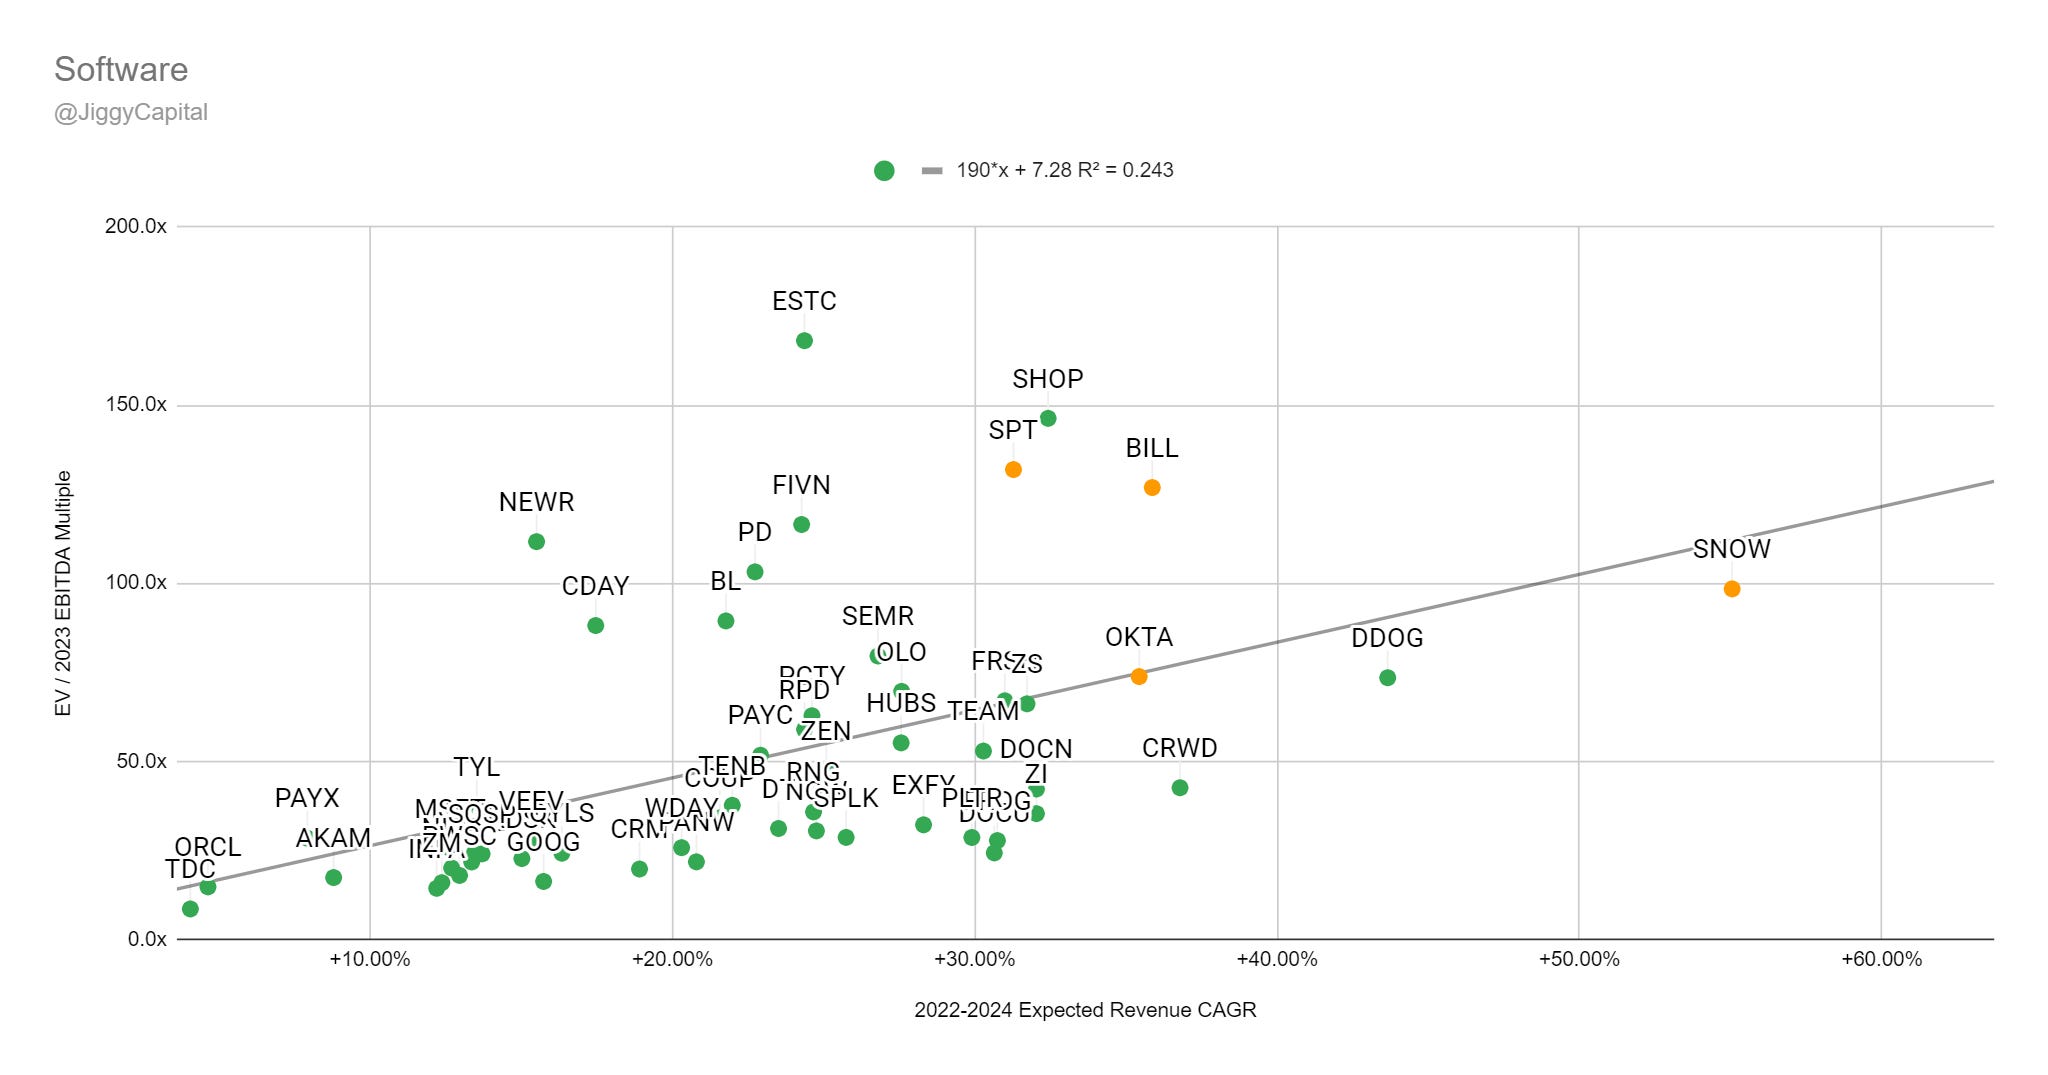
2022-2024 Revenue CAGR vs EV/2023 EBITDA Multiple:
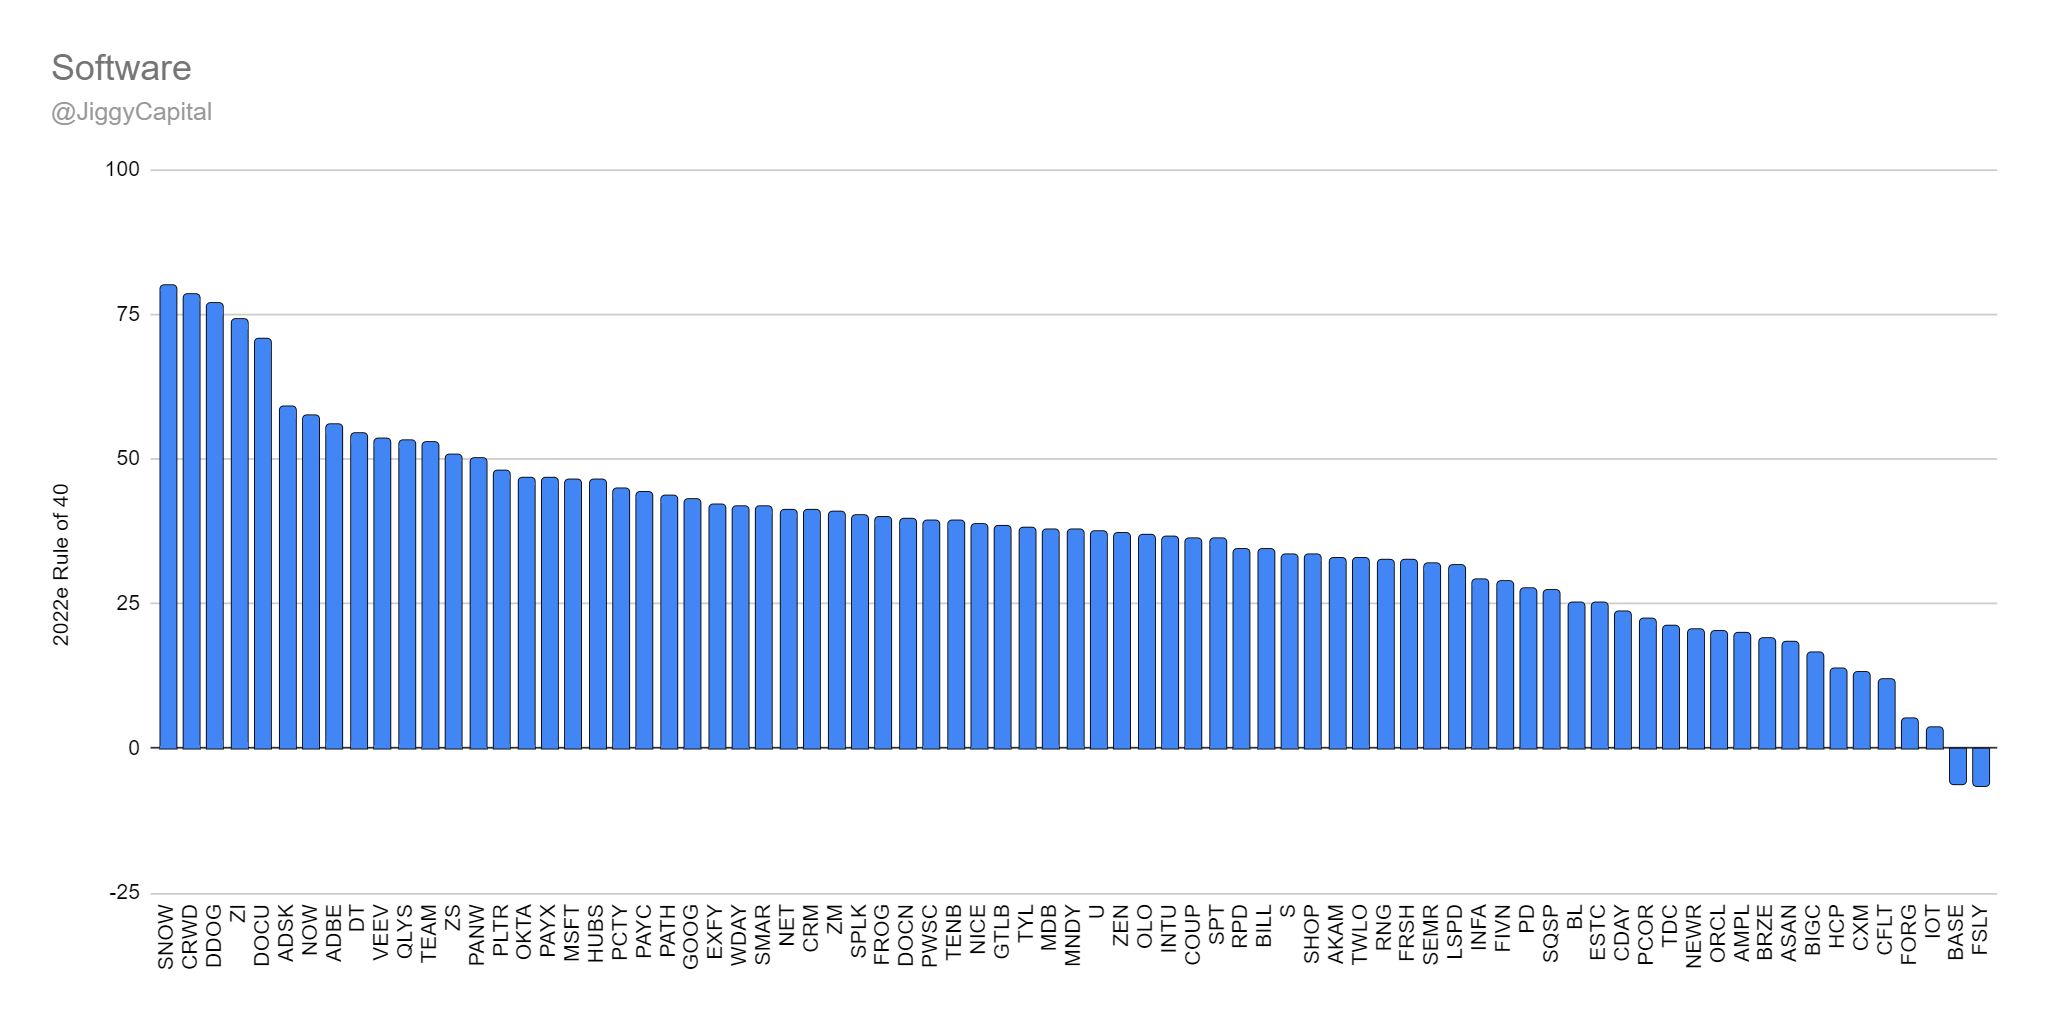
2022e Rule of 40 Scores:
Sector Stats:
Median Gross Margins: 74%
Median 2022e FCF Margin: 7%
Median 2022-2024 Projected Revenue CAGR: 25%
Median 2022e Rule of 40 Score: 38
Median 2022e FCF Yield %: 1.17%
Median EV/2023e GP Multiple: 8.2x
Median EV/2023e FCF Multiple: 35.3x
Sector Highlights:
Best Gross Margins: Autodesk — 92%
Best 2022e FCF Margins: Autodesk — 43%
Best 2022-2024 Projected Revenue CAGR: SentinelOne — 63%
Best 2022e Rule of 40 Score: Snowflake — 80
Best 2022e FCF Yield %: Teradata — 10.48%
Worst Gross Margins: Expensify — 42%
Worst 2022e FCF Margins: SentinelOne — -39%
Worst 2022-2024 Projected Revenue CAGR: Teradata — 4%
Worst 2022e Rule of 40 Score: Fastly — -7
Worst 2022e FCF Yield %: Fastly — -6.73%
Scatter Plot Trendline Error Percentage:
“Undervalued”:
Gross Profit: JFrog (+142%)
EBITDA: DocuSign (+174%)
“Overvalued”:
Gross Profit: Tyler Technologies (-58%)
EBITDA: Elastic (-68%)
Full Data:
Gross Profit:
EBITDA:
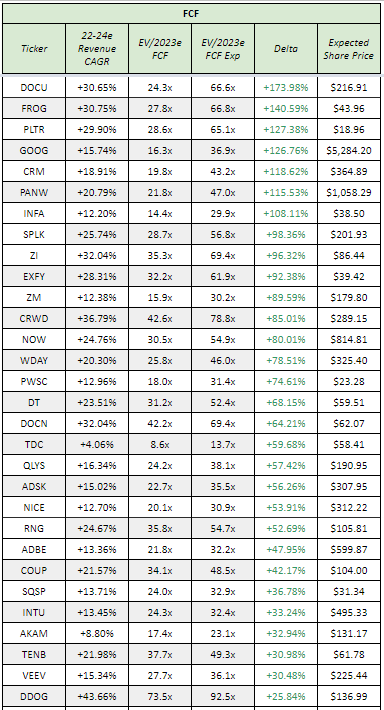
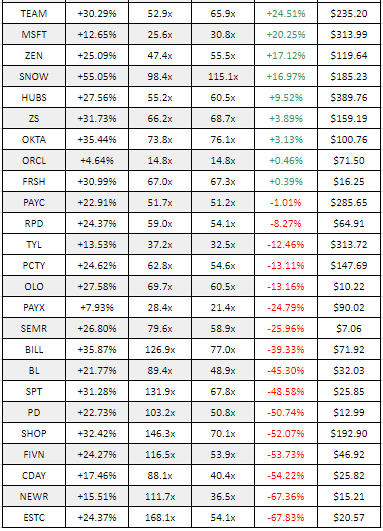
My Take
SentinelOne is such an interesting case study of having the best growth paired with worst margins into a pretty tough macro environment for that kind of scenario. I wouldn’t be surprised if investors are rewarded over the long term here as it’s sold off quite a bit but they’re taking on quite a bit a risk no doubt!
I’m semi-surprised Ceridian doesn’t have better financials.
Conclusion
I hope this was an enjoyable read and provided that extra inspiration to start digging on a company you’ve been debating digging into. I hope to be adding more and more data/value to each of these editions!
Here are my personal top standouts from each sector:
Application Software: Salesforce
Financial Services: Visa
Infrastructure Software: Datadog
Internet: CarGurus
Semiconductors: Taiwan Semiconductor
Software: JFrog
Feedback is more than welcome, and thank you to the people who have reached out via Twitter DMs or mentions.
We are in some tough times in the market but if you take advantage of the time arbitrage on a longer horizon for quality long term companies
I still remind people — and myself — this kind of above analysis is just one small piece of the puzzle when making an overall investing decision!
On a personal note a I started a new job last month at a public SaaS company (still in sales) which is why I haven’t been unfortunately writing as much as I’d like, but hope to get back at it as I get into a new normal.
I couldn’t be more excited about the career change and there’s zero doubt it wouldn’t have happened if it wasn’t for getting interested in investing.
Keep on trucking everyone!
- Sean