


Q1 2022: Sector Analysis
The Jiggy Capital Newsletter #9

Overview
For this first newsletter of Q1 2022, I’m going to be doing my third edition of Sector Analysis. For this edition, I’ve trimmed it down into being very tech focused going from 14 sectors analyzed to now 9 more focused ones. The generalist in me is slowly dying I must say…
I’ve also made a V2 spreadsheet for this new group of 9 sectors that hopefully will load quicker and more reliably. That can be found here, and the data and scatter plots update in real time! Thank you to everyone who has given feedback and kind words on the financial watchlist spreadsheet.
I’ll be breaking down each sector into 5 main parts:
Scatter Plots: This will be where the EV/GP and EV/EBITDA scatter plots will be shown. I decided I’m not going to publish the full spreadsheet data this time around since it was so messy last time but I’ll be linking my spreadsheet public to view at the bottom.
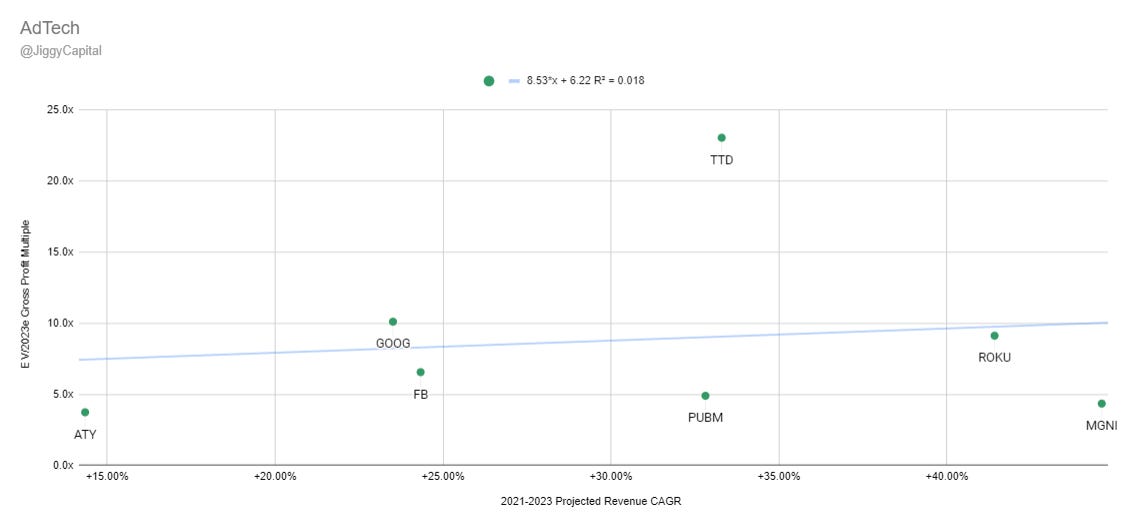
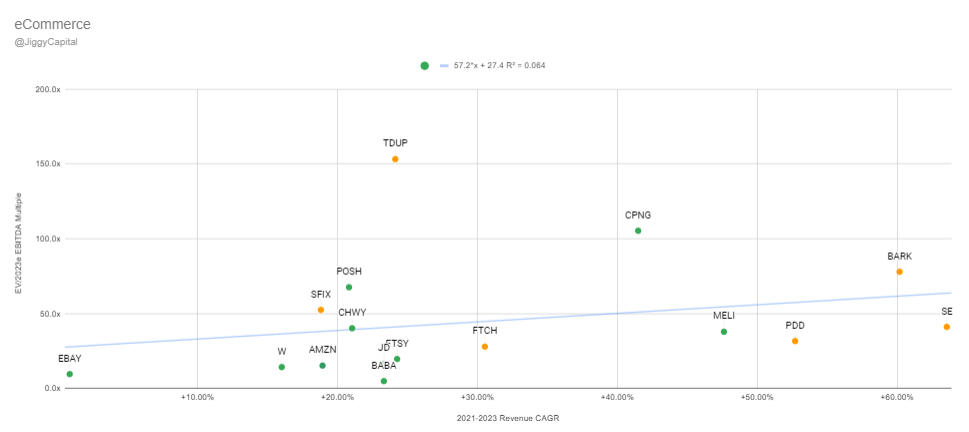
2021-2023 Projected Revenue CAGR vs. Enterprise Value / 2023 Expected Gross Profit (EV/2023 GP)
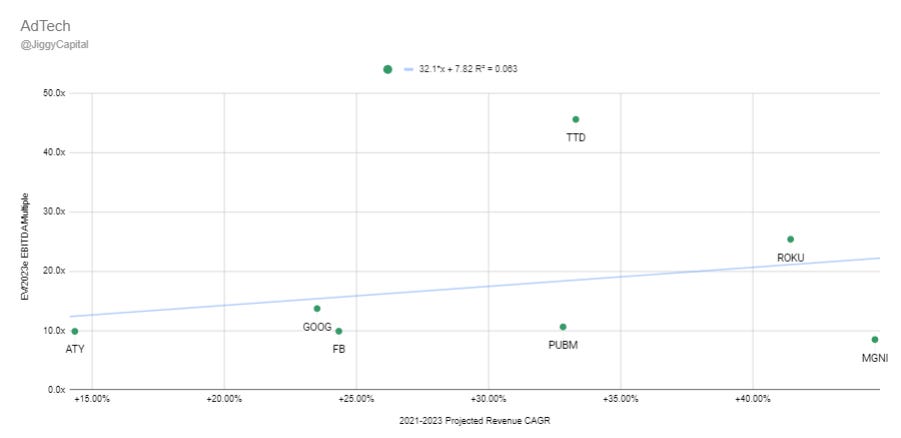
2021-2023 Projected Revenue CAGR vs. Enterprise Value / 2023 Expected EBITDA (EV/2023 EBITDA)
Where the scatter plot dots have a color code:
Green = Company is EBITDA positive in 2021
Orange = Company is projected to be EBITDA positive by 2023
Red = Company is not projected to be EBITDA positive by 2023
Sector Stats: I’ll be highlighting the sectors median 2021-2023 revenue CAGR, gross margins, EV/2022e GP and EV/2022e EBITDA multiples. I’ll use averages for sectors with a dataset under 10 companies.
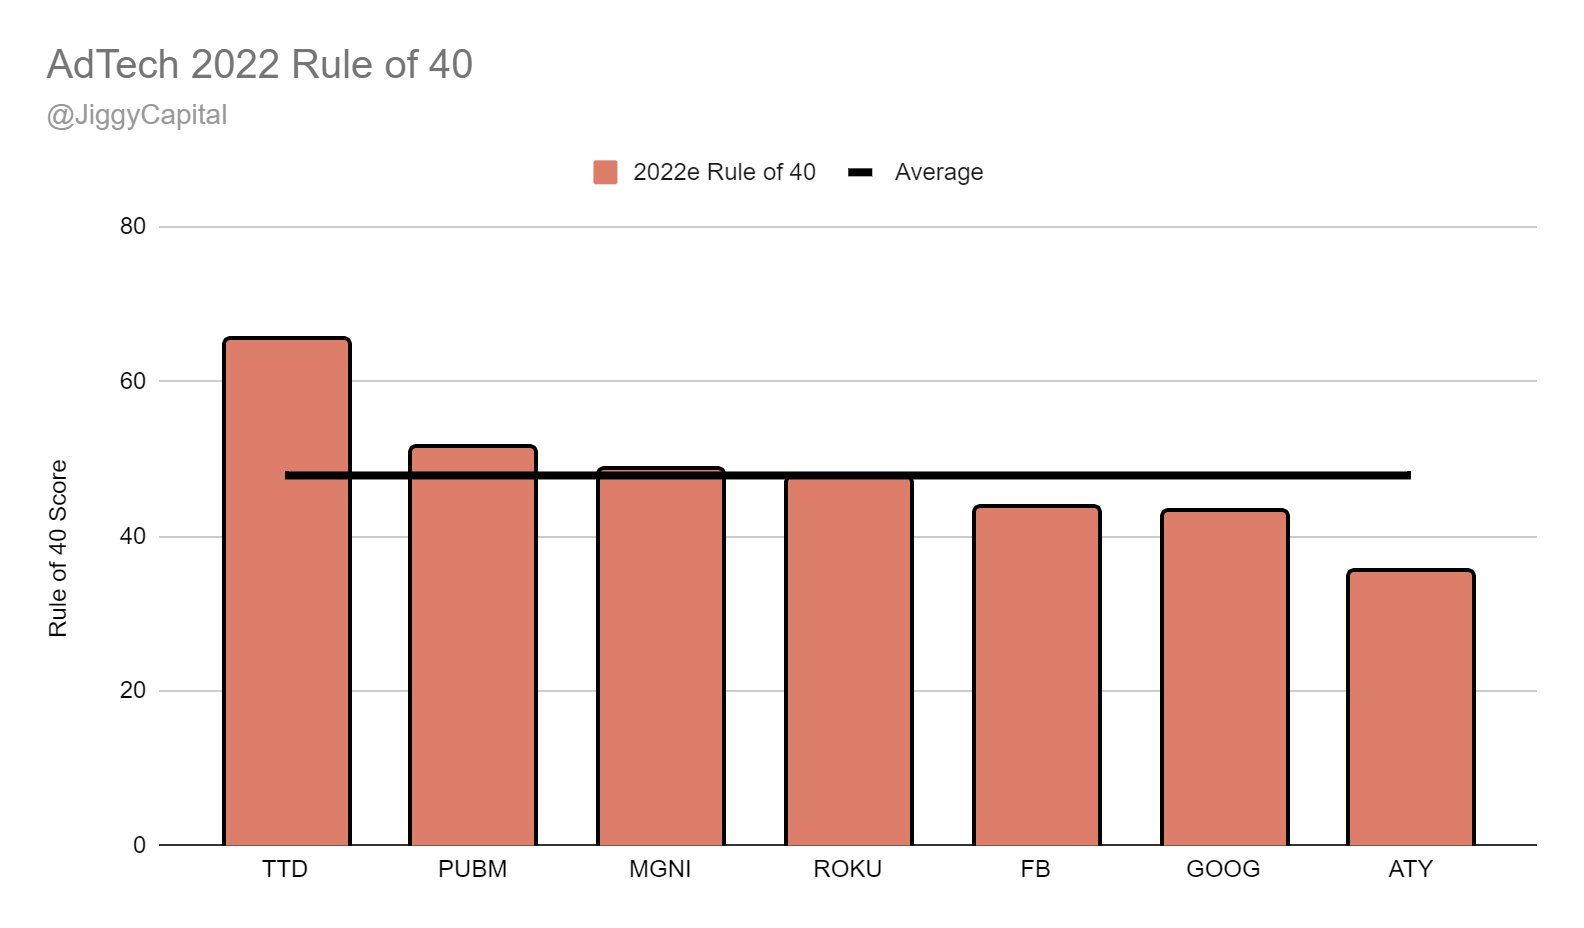
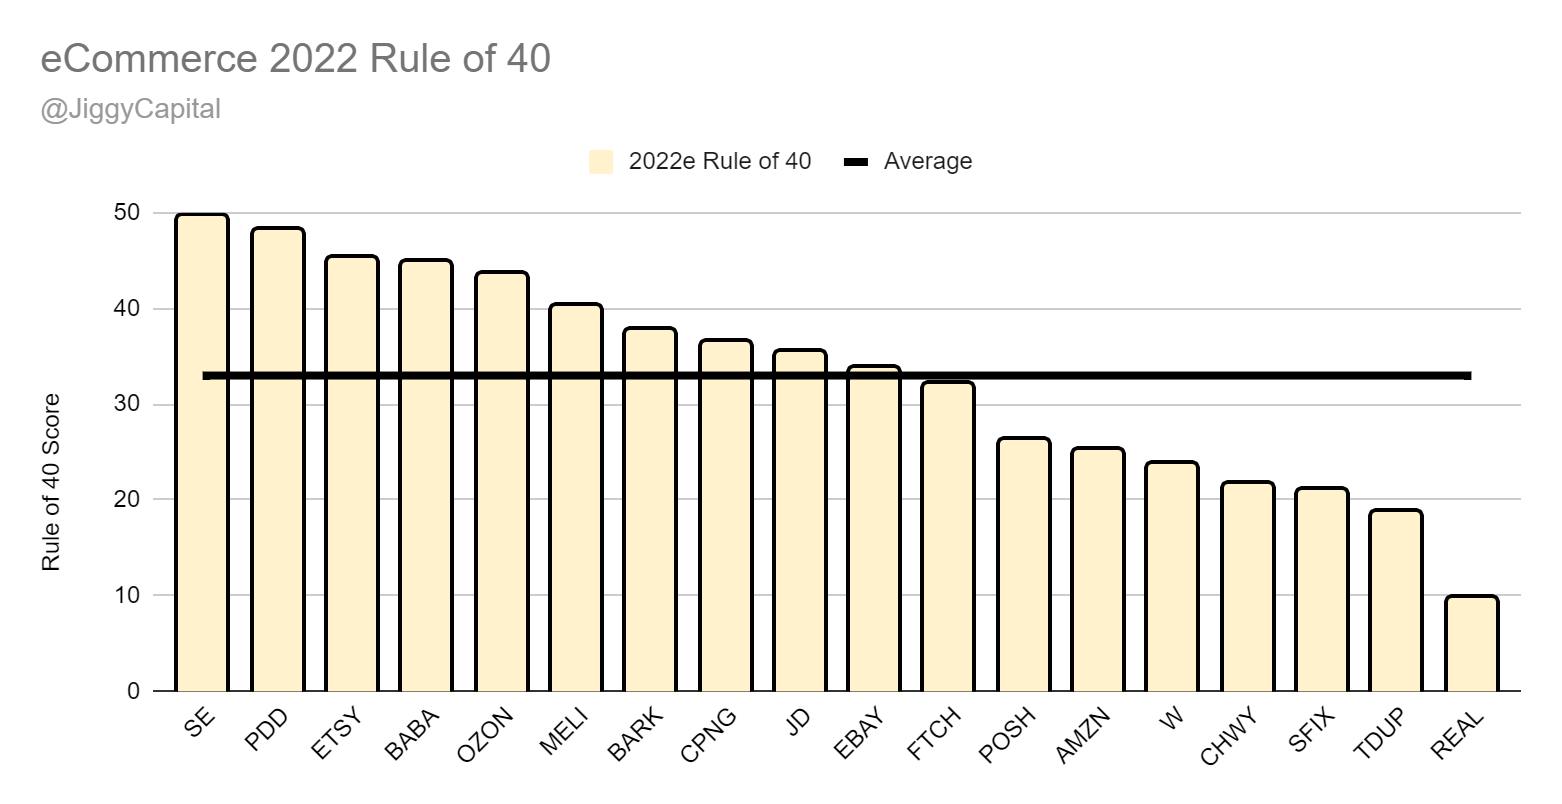
Sector Highlights: I’ll be highlighting the companies with the strongest and weakest gross margins, EBITDA margins, and 2021-2023 projected revenue CAGR. I’ll also insert the groups 2022 Rule of 40 chart here.
Scatter Plot Trendline Error Percentage: Using the sector scatter plot generated trendline equation, I look at the biggest discrepancies between their actual EV/2022e GP and EBITDA multiples versus their expected ones.
My Take: A quick one or two sentence take on the output data.
The forward projections are taken from Koyfin average analyst estimates, which I use multiple times a day and think it’s the best service out there for any fundamental company analysis. I also use their Enterprise Value data, and the rest comes from google finance function on google sheets.
The sectors I will be looking at in the newsletter are:
AdTech
Big Tech
Cloud Infrastructure
eCommerce
Fintech
Gaming
Platform
SaaS Applications
Software
Before we get started, I want to go over key assumptions:
I’m assuming the financial information gathered is correct - Please let me know if something is off for a company I’d be happy to look into it further and correct it.
I’m assuming with gross profit projections their gross profit margin won’t change - This obviously isn’t reality as margins expand/contract over time as a companies business changes/scales but this is the best I can do (as of now at least).
This was a big reason why I thought the EBITDA multiples addition would be a good idea as I get those direct numbers from Koyfin, whereas with GP projections I use their analyst projected revenue and multiply it by their 2020 gross profit margin.
Gross profit margin is also a metric that can be left for some company interpretation where you can hide some costs elsewhere. This is only one piece of the puzzle and shouldn’t be used as financial advice and taken with a grain of salt.
This is not looking at the quality of a company, management, market position, runway, and even more importantly the quality of revenue profile (recurring vs transaction-based vs unrelated one-time revenues).
I’ll also mention with the EBITDA scatter plots is some companies that are way out of whack are companies that are just becoming EBITDA or FCF positive (in most cases barely at first), so naturally their multiple will be extremely large. I would make note that there are a fair amount from most groups that still don’t have 2023 EBITDA multiples.
Another add to this edition is the Jiggy Capital Score (JC Score), which is my take on an updated P/E/G ratio. The formula is fairly simple:
JC Score = 2022 Rule of 40 Score / (EV/2023 Gross Profit Multiple) As you can see, this is a forward looking metric still but gives an equal weighting positive impact to FCF margins as well as growth. The higher this metric the better!
Now let’s get into it!
Sector Analysis
AdTech
Group: AcuityAds (ATY), Meta Platforms (FB), Alphabet Inc (GOOG), Magnite (MGNI), PubMatic (PUBM), Roku (ROKU), The Trade Desk (TTD)
2021-2023 Revenue CAGR vs EV/2023 Gross Profit Multiple:
2021-2023 Revenue CAGR vs EV/2023 EBITDA Multiple:
Sector Stats:
Average Gross Margins: 66%
Average 2023e EBITDA Margin: 32%
Average 2021-2023 Projected Revenue CAGR: 16%
Average 2022e Rule of 40 Score: 48
Average JC Score: 7.46
Average EV/2023e GP Multiple: 11x
Average EV/2023e EBITDA Multiple: 23x
Sector Highlights:
Strongest Gross Margins: The Trade Desk (82%)
Strongest 2022e EBITDA Margins: Meta Platforms (49%)
Strongest 2021-2023 Projected Revenue CAGR: Magnite (45%)
Strongest 2022e Rule of 40 Score: The Trade Desk (66)
Strongest JC Score: Magnite (12.45)
Weakest Gross Margins: Roku (51%)
Weakest 2022e EBITDA Margins: Roku (13%)
Weakest 2021-2023 Projected Revenue CAGR: ActuityAds (14%)
Weakest 2022e Rule of 40 Score: AcuityAds (35)
Weakest JC Score: The Trade Desk (2.98)
Scatter Plot Trendline Error Percentage:
“Undervalued”:
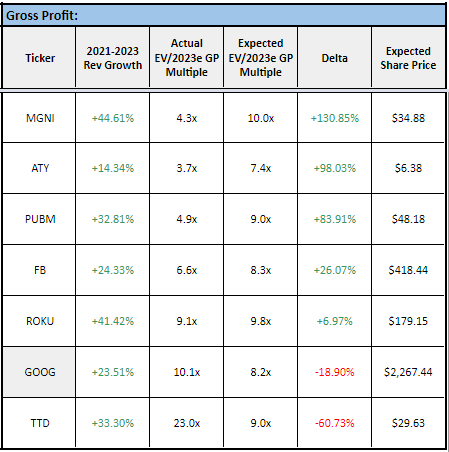
Gross Profit: Magnite (137% Upside)
EBITDA: Magnite (187% Upside)
“Overvalued”:
Gross Profit: The Trade Desk (-62% Downside)
EBITDA: The Trade Desk (-58% Downside)
Full Data:
Gross Profit:
EBITDA:
My Take
Magnite continues to confuse me with it’s attractive financial metrics but continues to flutter in the wind. The Trade Desk premium multiple starts to make more sense when you look at just how impressive their bottom line margins are.
Big Tech
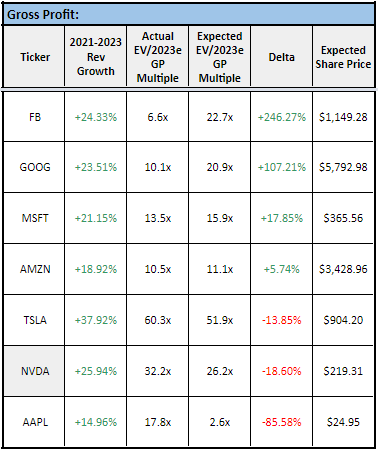
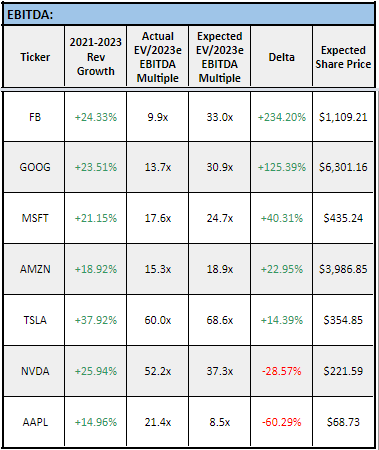
Group: Apple (AAPL), Amazon (AMZN), Meta Platforms (FB), Alphabet Inc (GOOG), Microsoft (MSFT), Nvidia (NVDA), Tesla (TSLA)
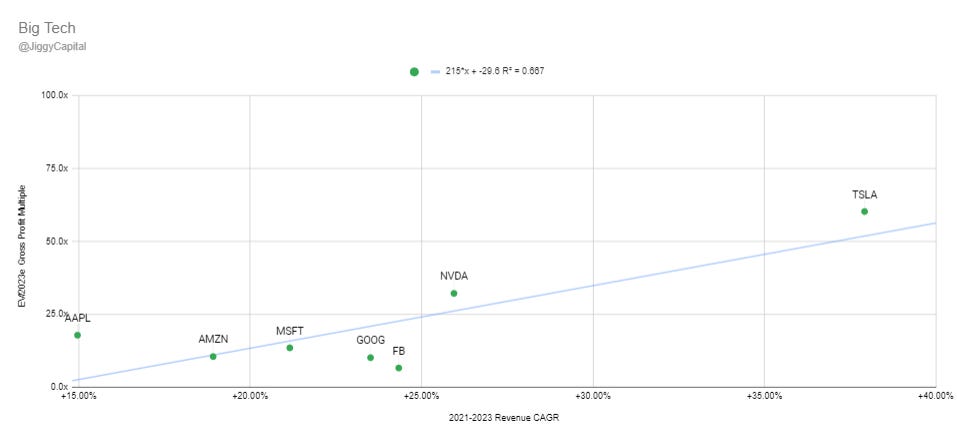
2021-2023 Revenue CAGR vs EV/2022 Gross Profit Multiple:
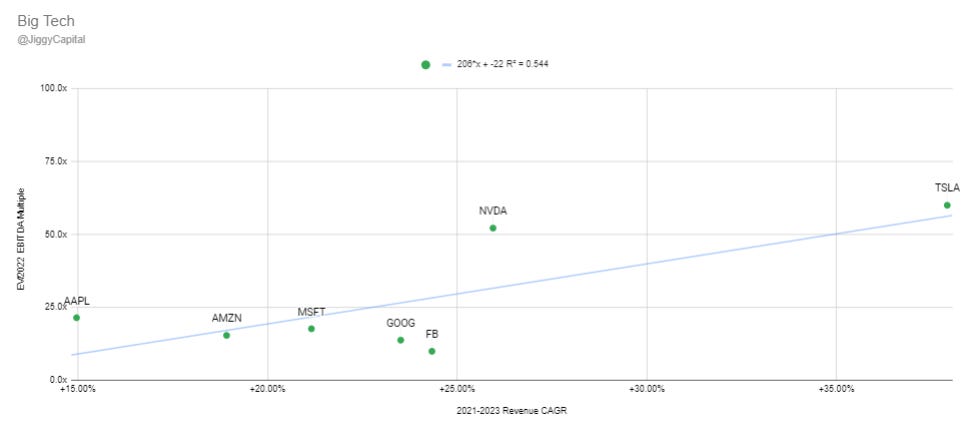
2021-2023 Revenue CAGR vs EV/2022 EBITDA Multiple:
Sector Stats:
Average Gross Margins: 52%
Average 2022e EBITDA Margin: 35%
Average 2021-2023 Projected Revenue CAGR: 24%
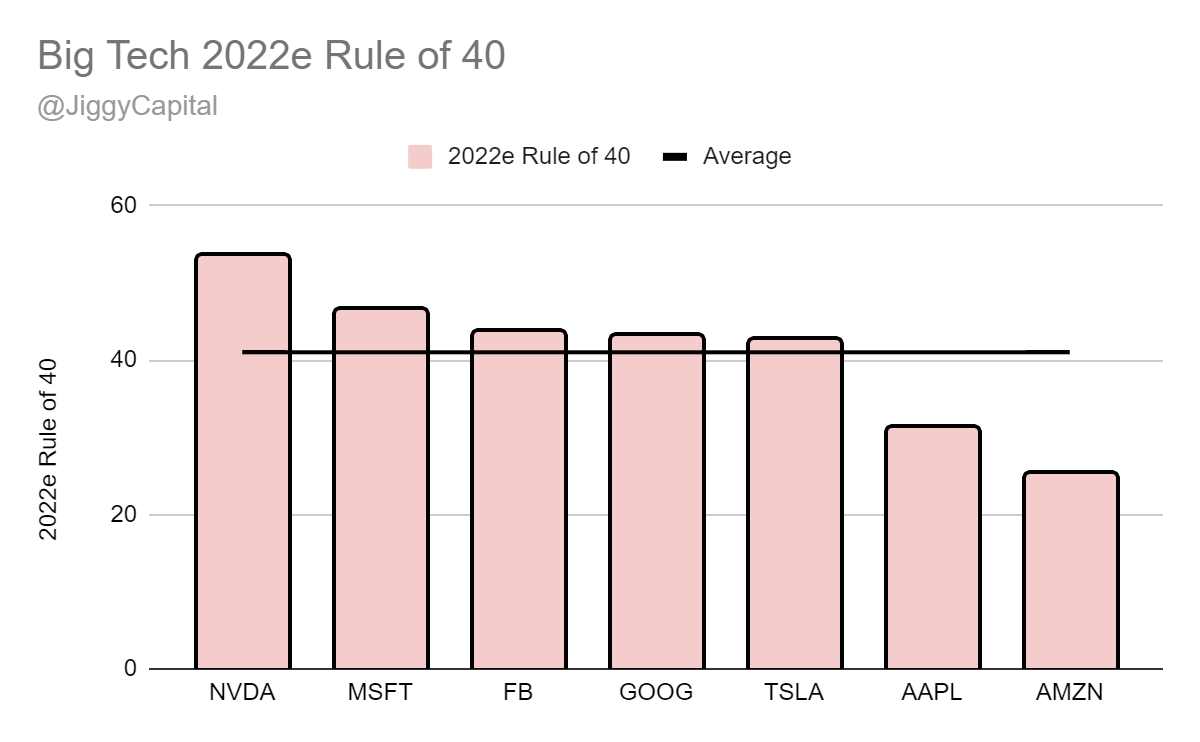
Average 2022e Rule of 40 Score: 41
Average JC Score: 3.07
Average EV/2023e GP Multiple: 22x
Average EV/2023e EBITDA Multiple: 27x
Sector Highlights:
Strongest Gross Margins: Meta Platforms (79%)
Strongest 2022e EBITDA Margins: Microsoft (50%)
Strongest 2021-2023 Projected Revenue CAGR: Tesla (38%)
Strongest 2022e Rule of 40 Score: Nvidia (54)
Strongest JC Score: Meta Platform (6.55)
Weakest Gross Margins: Amazon (24%)
Weakest 2022e EBITDA Margins: Amazon (15%)
Weakest 2021-2023 Projected Revenue CAGR: Apple (15%)
Weakest 2022e Rule of 40 Score: Amazon (25)
Weakest JC Score: Tesla (0.88)
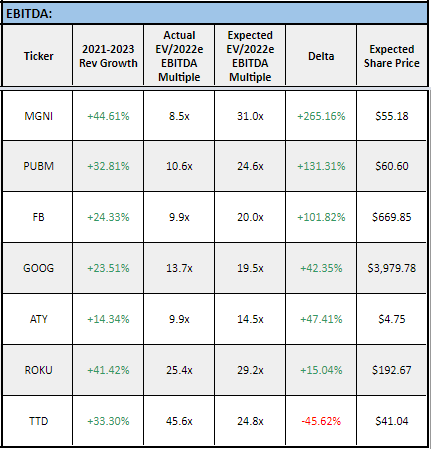
Scatter Plot Trendline Error Percentage:
“Undervalued”:
Gross Profit: Meta Platforms (246% Upside)
EBITDA: Meta Platforms (234% Upside)
“Overvalued”:
Gross Profit: Apple (-86% Downside)
EBITDA: Apple (-60% Downside)
Full Data:
Gross Profit:
EBITDA:
My Take
I’ve taken the controversial stance and have now added two new titans to the “Big Tech” group this time around with Tesla and Nvidia. Both companies have seen some amazing multiple expansion on the way to becoming mega-caps, but some would argue for good reason.
Facebook continues to be perpetually cheap but I still would rather own Alphabet instead at a lesser discount (and I do).
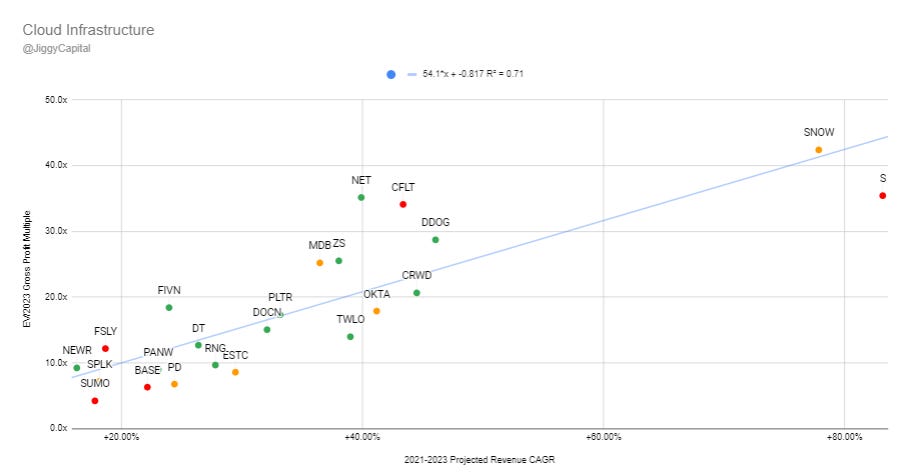
Cloud Infrastructure
Group: Couchbase (BASE), Confluent (CFLT), Crowdstrike (CRWD), Datadog (DDOG), DigitalOcean (DOCN), Dynatrace (DT), Elastic (ESTC), Five9 (FIVN), Fastly (FSLY), MongoDB (MDB), Cloudflare (NET), New Relic (NEWR), Okta (OKTA), Palo Alto Networks (PANW), Pagerduty (PD), Palantir (PLTR), RingCentral (RNG), SentinelOne (S), Snowflake (SNOW), Splunk (SPLK), Sumo Logic (SUMO, Twilio (TWLO), Zscaler (ZS)
2021-2023 Revenue CAGR vs EV/2023 Gross Profit Multiple:
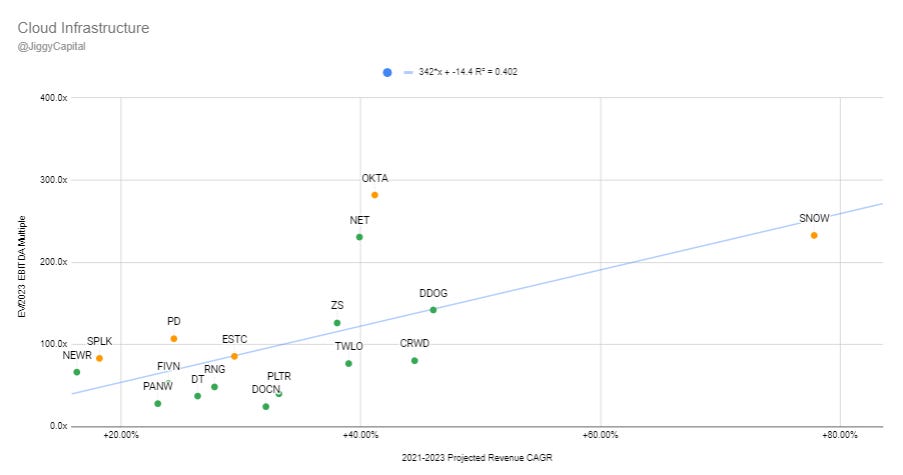
2021-2023 Revenue CAGR vs EV/2023 EBITDA Multiple:
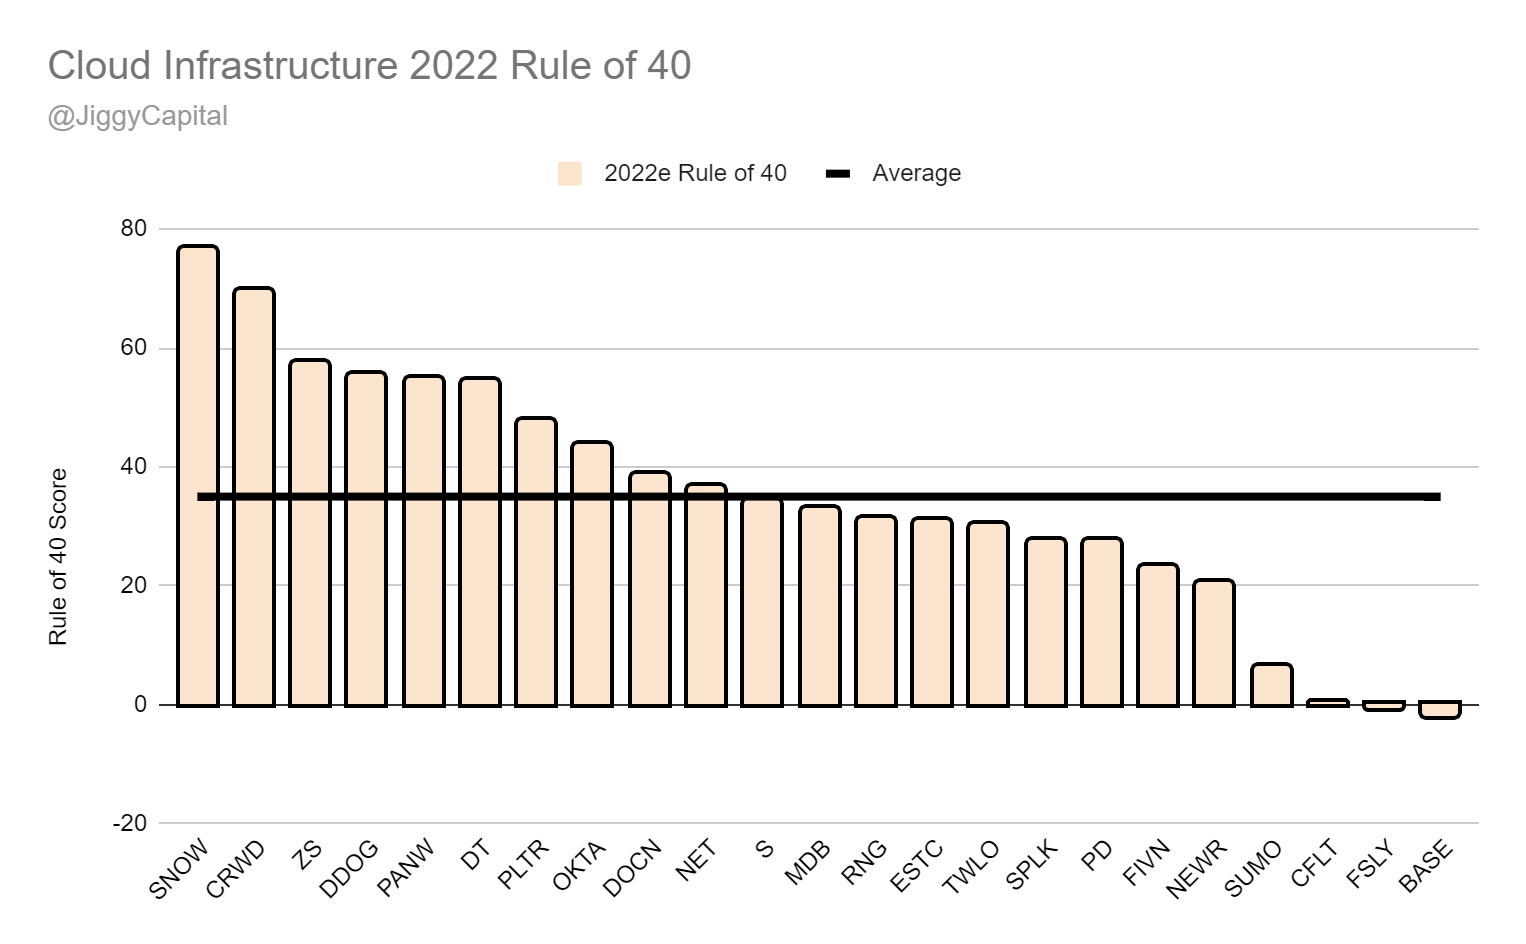
Sector Stats:
Median Gross Margins: 75%
Median 2022e EBITDA Margin: 8%
Median 2021-2023 Projected Revenue CAGR: 32%
Median 2022e Rule of 40 Score: 33
Median JC Score: 2.31
Median EV/2023e GP Multiple: 15x
Median EV/2023e EBITDA Multiple: 80x
Sector Highlights:
Strongest Gross Margins: Couchbase (86%)
Strongest 2022e EBITDA Margins: DigitalOcean (32%)
Strongest 2021-2023 Projected Revenue CAGR: SentinelOne (83%)
Strongest 2022e Rule of 40 Score: Snowflake (77)
Strongest JC Score: Palo Alto Networks (6.51)
Weakest Gross Margins: Twilio (54%)
Weakest 2022e EBITDA Margins: SentinelOne (-47%)
Weakest 2021-2023 Projected Revenue CAGR: NewRelic (16%)
Weakest 2022e Rule of 40 Score: Couchbase (-2)
Weakest JC Score: Couchbase (-0.29)
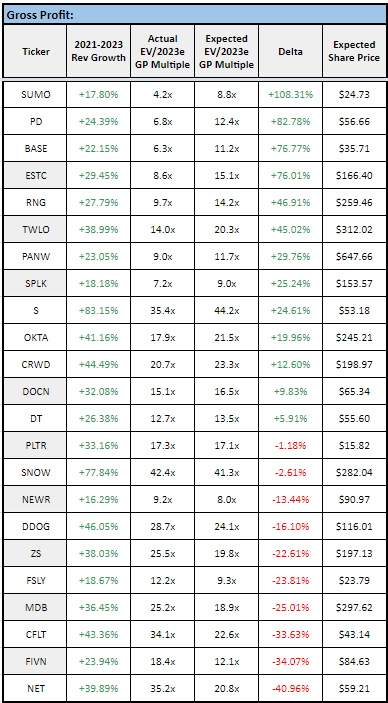
Scatter Plot Trendline Error Percentage:
“Undervalued”:
Gross Profit: Sumo Logic (108% Upside)
EBITDA: DigitalOcean (291% Upside)
“Overvalued”:
Gross Profit: Cloudflare (-41% Downside)
EBITDA: Okta (-55% Downside)
Full Data:
Gross Profit:
EBITDA:
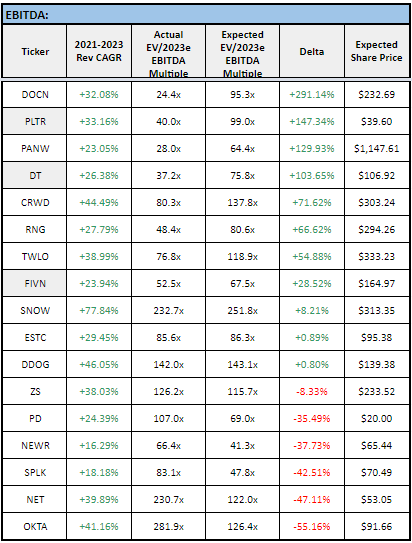
My Take
These are some of the growthiest growth stocks on the market that have multiples that’s made value investors cringe for most of the last two years. I enjoy being a mad lad that has crafted a mechanism for data to tell me that DDOG and SNOW are undervalued, while PD and NEWR are overvalued on 2023 EBITDA vs Growth comparisons.
It’s incredible how Cloudflare can get a 50%+ haircut and still be wildly overvalued to its peers here.
eCommerce
Group: Amazon (AMZN), Alibaba (BABA), BarkBox (BARK), Chewy (CHWY), Coupang (CPNG), eBay (EBAY), Etsy (ETSY), Farfetch (FTCH), JD.com (JD), Jumia (JMIA), Mercadolibre (MELI), Ozon (OZON), Pinduoduo (PDD), Poshmark (POSH), RealReal (REAL), Sea Limited (SE), Stitch Fix (SFIX), ThredUp (TDUP), Wayfair (W)
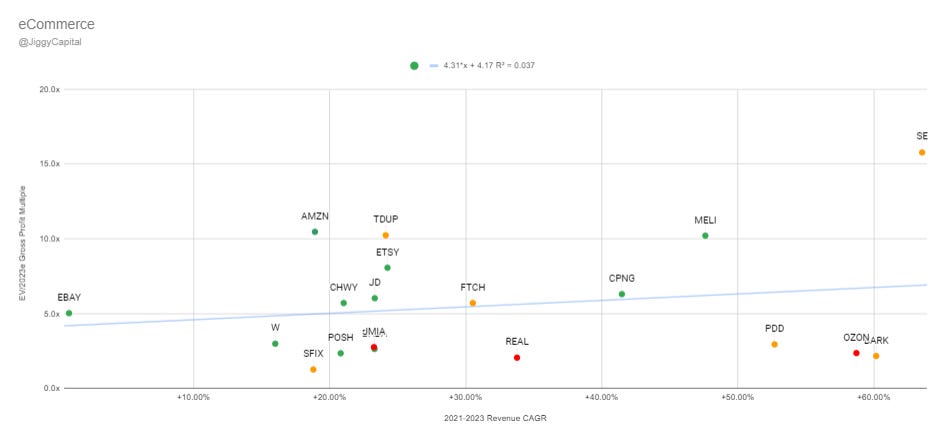
2021-2023 Revenue CAGR vs EV/2023 Gross Profit Multiple:
2021-2023 Revenue CAGR vs EV/2023 EBITDA Multiple:
Sector Stats:
Median Gross Margins: 47%
Median 2022e EBITDA Margin: 1%
Median 2021-2023 Projected Revenue CAGR: 24%
Median 2022e Rule of 40 Score: 33
Median JC Score: 5.64
Median EV/2023e GP Multiple: 4x
Median EV/2023e EBITDA Multiple: 38x
Sector Highlights:
Strongest Gross Margins: Poshmark (82%)
Strongest 2022e EBITDA Margins: eBay (38%)
Strongest 2021-2023 Projected Revenue CAGR: Sea Limited (64%)
Strongest 2022e Rule of 40 Score: Sea Limited (50)
Strongest JC Score: Ozon (23.66)
Weakest Gross Margins: JD.com (14%)
Weakest 2022e EBITDA Margins: TheRealReal (-13%)
Weakest 2021-2023 Projected Revenue CAGR: eBay (1%)
Weakest 2022e Rule of 40 Score: TheRealReal (10)
Weakest JC Score: ThredUp (1.92)
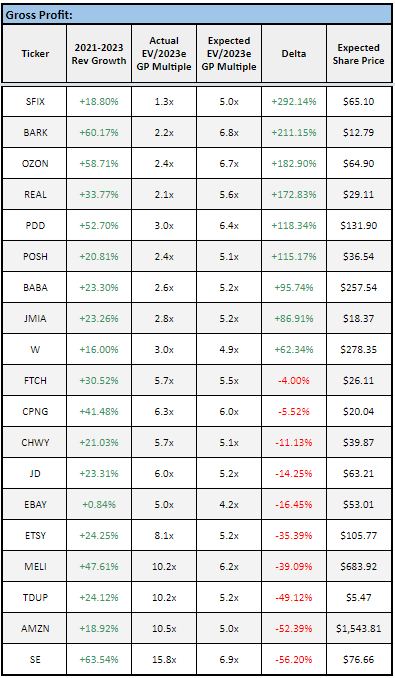
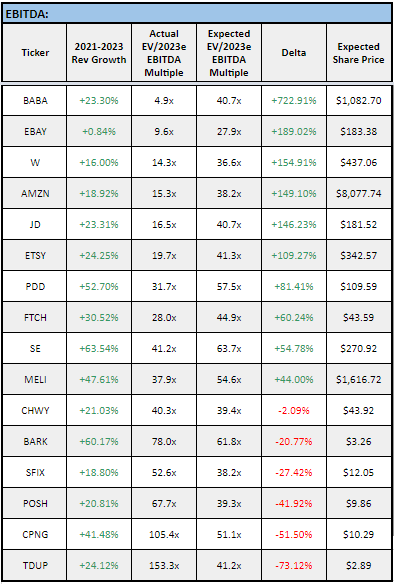
Scatter Plot Trendline Error Percentage:
“Undervalued”:
Gross Profit: StitchFix (292% Upside)
EBITDA: Alibaba (723% Upside)
“Overvalued”:
Gross Profit: Sea Limited (-56% Downside)
EBITDA: ThredUp (-73% Downside)
Full Data:
Gross Profit:
EBITDA:
My Take
These eCommerce gross profit multiples are probably some of the most reasonable on the market with growth stocks, but I’m still not much an eCommerce fan anymore. Someone needs to buyout Poshmark and Bark already…
Fintech
Group: Affirm (AFRM), Avalara (AVLR), Bill.com (BILL), Blend Labs (BLND), Coinbase (COIN), dLocal (DLO), Fiserv (FISV), Flywire (FLYW), Shift4 Payments (FOUR), Futu Holdings (FUTU), Global-E (GLBE), Robinhood (HOOD), LendingClub (LC), Marqeta (MQ), Nuvei (NVEI), PagSeguro (PAGS), Paysafe (PSFE), PayPal (PYPL), SoFi (SOFI), Block (SQ), StoneCo (STNE), Constellation Brands (STZ), Up Fintech (TIGR), Toast (TOST), Upstart (UPST),
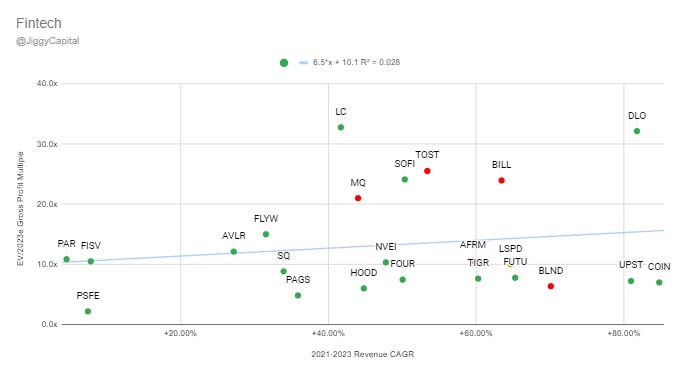
2021-2023 Revenue CAGR vs EV/2023 Gross Profit Multiple:
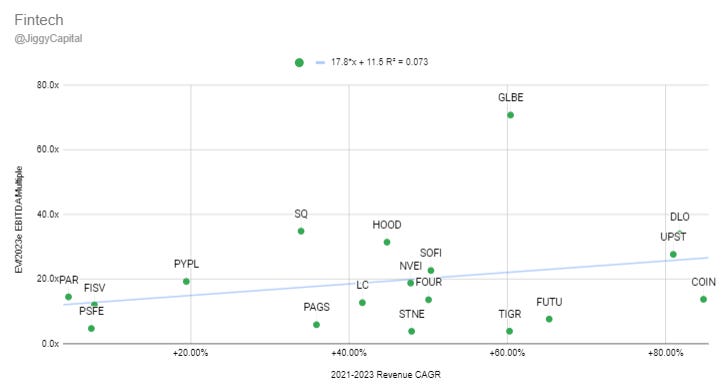
2021-2023 Revenue CAGR vs EV/2023 EBITDA Multiple:
Sector Stats:
Median Gross Margins: 51%
Median 2022e EBITDA Margin: 17%
Median 2021-2023 Projected Revenue CAGR: 49%
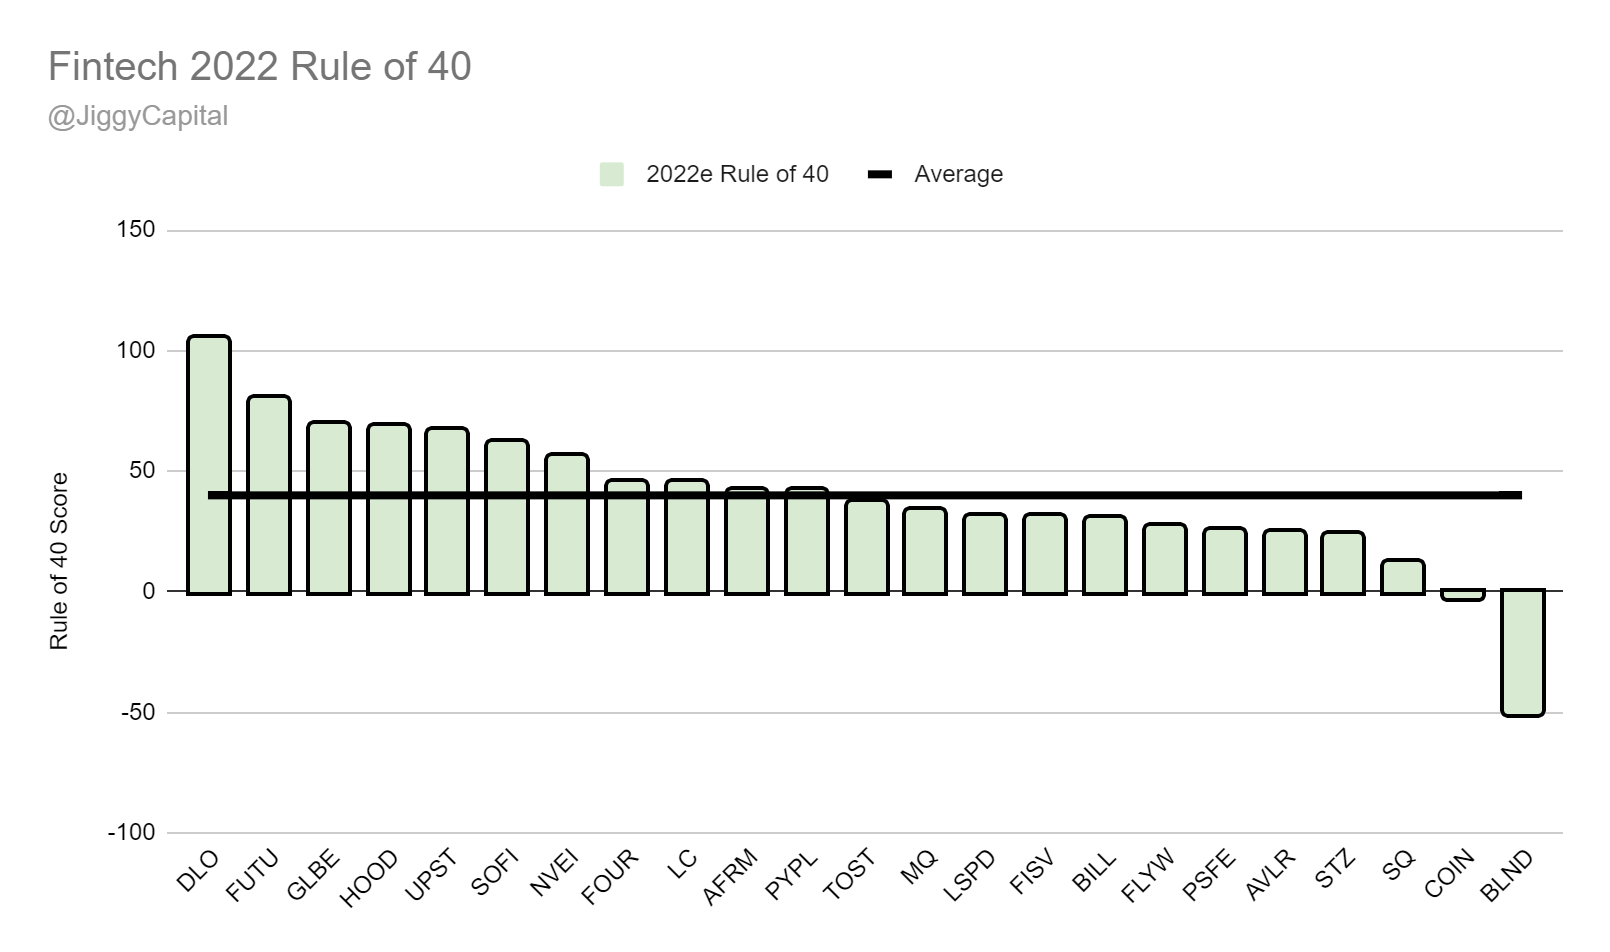
Median 2022e Rule of 40 Score: 37
Median JC Score: 3.02
Median EV/2023e GP Multiple: 10x
Median EV/2023e EBITDA Multiple: 14x
Sector Highlights:
Strongest Gross Margins: Coinbase (80%)
Strongest 2022e EBITDA Margins: StoneCo (48%)
Strongest 2021-2023 Projected Revenue CAGR: Coinbase (85%)
Strongest 2022e Rule of 40 Score: dLocal (106)
Strongest JC Score: Robinhood (11.31)
Weakest Gross Margins: LendingClub (7%)
Weakest 2022e EBITDA Margins: Blend Labs (-44%)
Weakest 2021-2023 Projected Revenue CAGR: Constellation Brands (5%)
Weakest 2022e Rule of 40 Score: Blend Labs (-55)
Weakest JC Score: Blend Labs (-5.88)
Scatter Plot Trendline Error Percentage:
“Undervalued”:
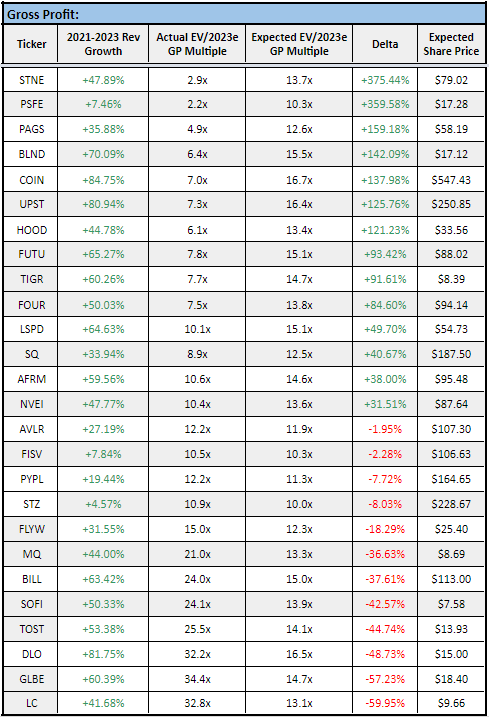
Gross Profit: StoneCo (375% Upside)
EBITDA: Up Fintech (460% Upside)
“Overvalued”:
Gross Profit: Lending Club (-59% Downside)
EBITDA: Global-E (-69% Downside)
Full Data:
Gross Profit:
EBITDA:
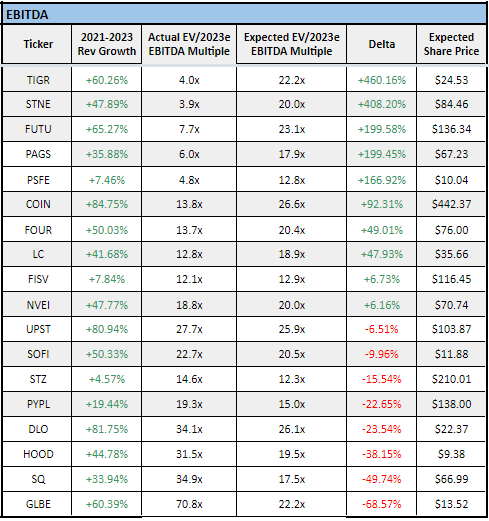
My Take
This continues to be a very widespread scatter plot group where there isn’t correlation between the two factors evidently. One of the main reasons for that is the many distressed stocks in the group like TIGR, STNE, FUTU, PAGS, PSFE that skews how things look.
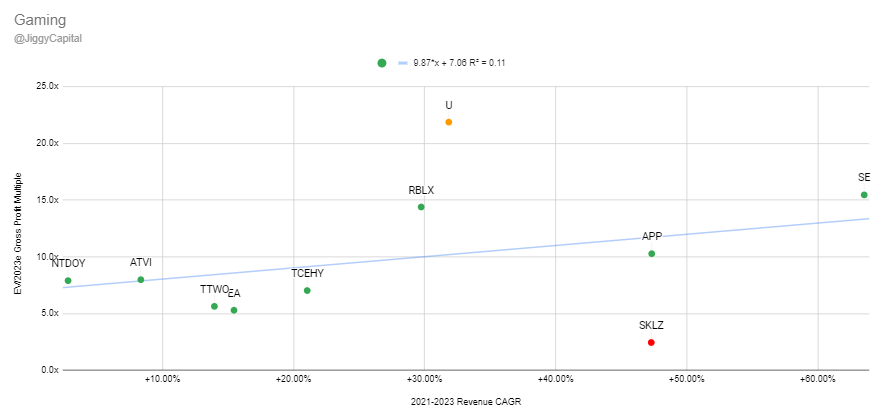
Gaming
Group: Applovin (APP), Activision Blizzard (ATVI), Electronic Arts (EA), Nintendo (NTDOY), Roblox (RBLX), Sea Limited (SE), Skillz (SKLZ), Tencent (TCEHY), Take-Two Interactive (TTWO), Unity (U)
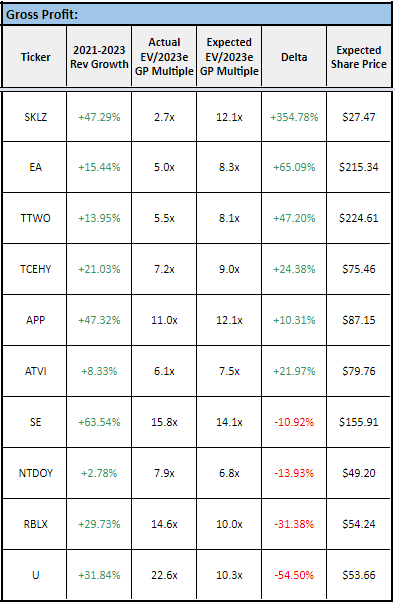
2021-2023 Revenue CAGR vs EV/2023 Gross Profit Multiple:
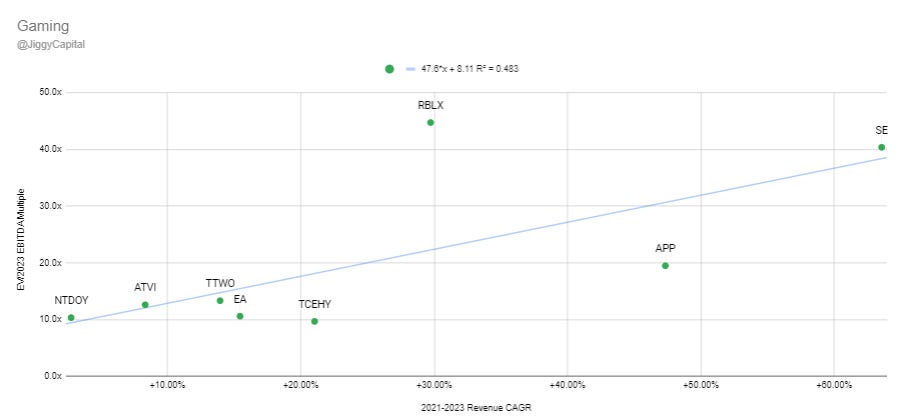
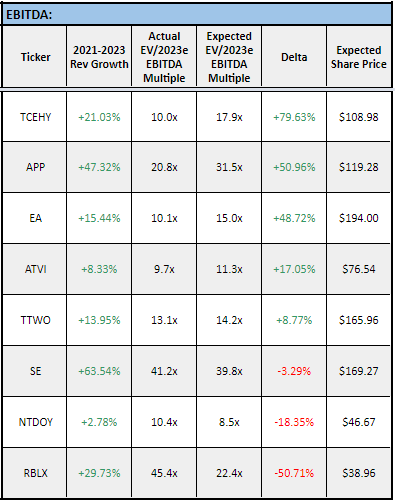
2021-2023 Revenue CAGR vs EV/2023 EBITDA Multiple:
Sector Stats:
Average Gross Margins: 67%
Average 2022e EBITDA Margin: 24%
Average 2021-2023 Projected Revenue CAGR: 28%
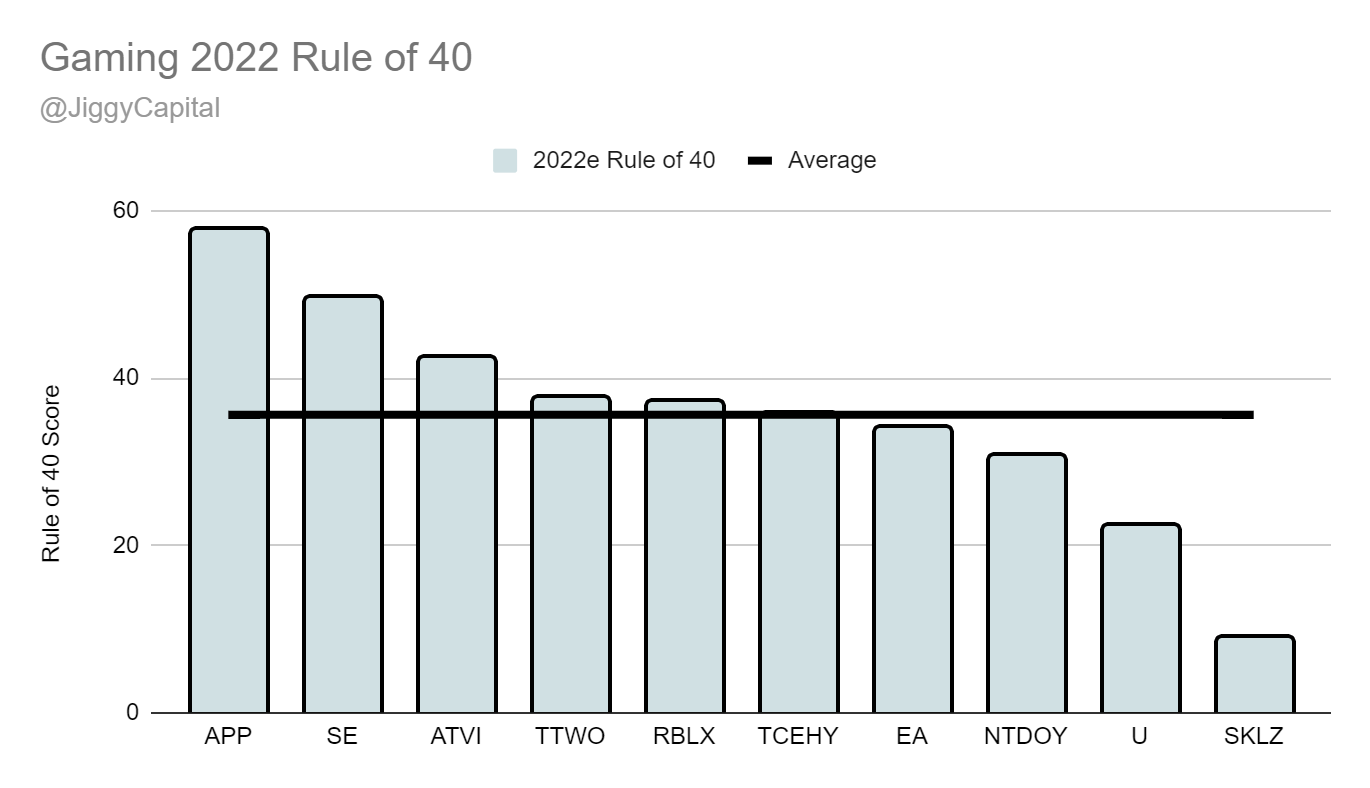
Average 2022e Rule of 40 Score: 36
Average JC Score: 4.49
Average EV/2023e GP Multiple: 8x
Average EV/2023e EBITDA Multiple: 12x
Sector Highlights:
Strongest Gross Margins: Skillz (93%)
Strongest 2022e EBITDA Margins: Activision Blizzard (45%)
Strongest 2021-2023 Projected Revenue CAGR: Sea Limited (64%)
Strongest 2022e Rule of 40 Score: Applovin (58)
Strongest JC Score: Activision Blizzard (7.21)
Weakest Gross Margins: Sea Limited (42%)
Weakest 2022e EBITDA Margins: Skillz (-1%)
Weakest 2021-2023 Projected Revenue CAGR: Nintendo (3%)
Weakest 2022e Rule of 40 Score: Skillz (9)
Weakest JC Score: Unity (1.01)
Scatter Plot Trendline Error Percentage:
“Undervalued”:
Gross Profit: Skillz (355% Upside)
EBITDA: Tencent (79% Upside)
“Overvalued”:
Gross Profit: Unity (-55% Downside)
EBITDA: Roblox (-51% Downside)
Full Data:
Gross Profit:
EBITDA:
My Take
As I type this, I just saw that Activision Blizzard is getting bought by Microsoft for 69B, almost a 40% premium from the values shown above. What I found interesting is this data isn’t even showing ATVI trading at a discount for it’s projected growth, but there’s more to it as the company has mature earnings.
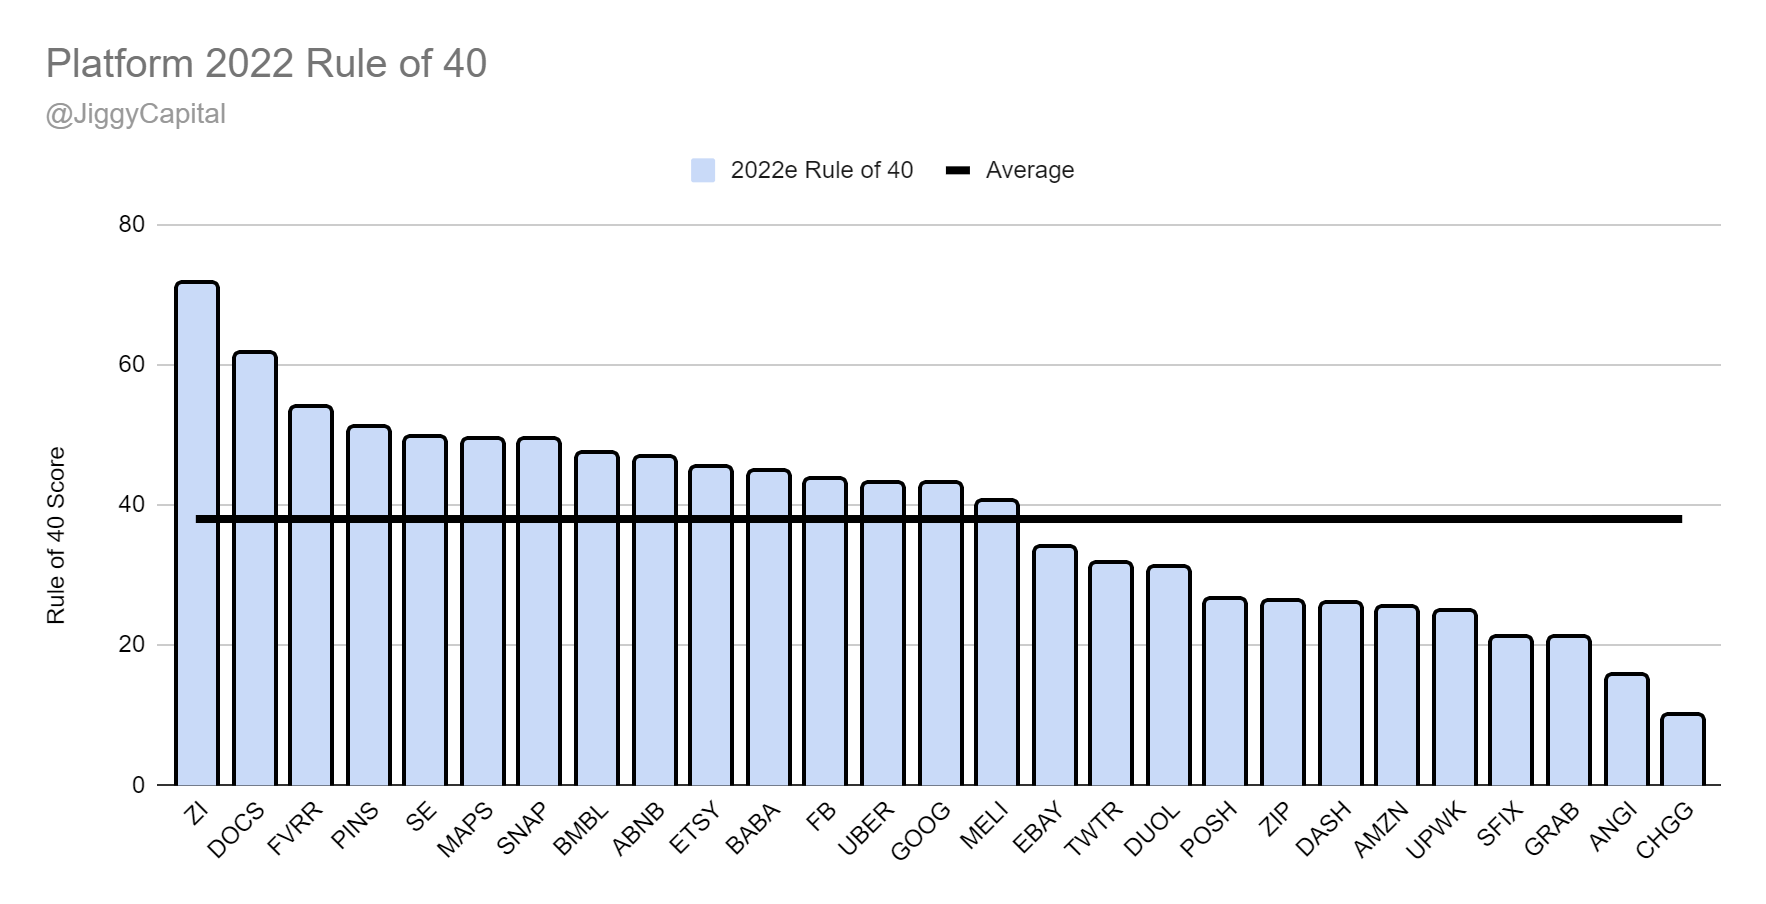
Platform
Group: Airbnb (ABNB), Amazon (AMZN), Angi (ANGI), Alibaba (BABA), Bumble (BMBL), Chegg (CHGG), DoorDash (DASH), Doximity (DOCS), Duolingo (DUOL), eBay (EBAY), Etsy (ETSY), Grab (GRAB), Meta Platforms (FB), Fiverr (FVRR), Alphabet (GOOG), Weedmaps (MAPS), Mercadolibre (MELI), Pinterest (PINS), Poshmark (POSH), Sea Limited (SE), Stitch Fix (SFIX), Snap Inc (SNAP), Twitter (TWTR), Uber (UBER), Upwork (UPWK), ZoomInfo (ZI), ZipRecruiter (ZIP)
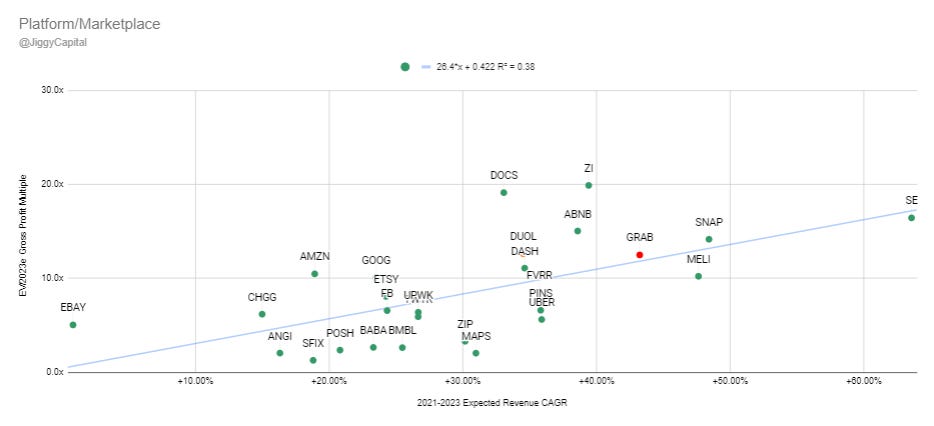
2021-2023 Revenue CAGR vs EV/2023 Gross Profit Multiple:
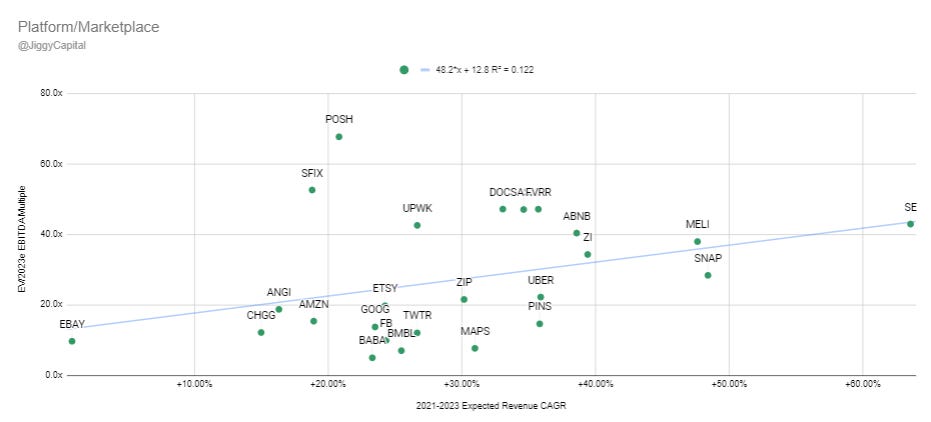
2021-2023 Revenue CAGR vs EV/2023 EBITDA Multiple:
Sector Stats:
Median Gross Margins: 73%
Median 2022e EBITDA Margin: 9%
Median 2021-2023 Projected Revenue CAGR: 30%
Median 2022e Rule of 40 Score: 43
Median JC Score: 4.45
Median EV/2023e GP Multiple: 7x
Median EV/2023e EBITDA Multiple: 22x
Sector Highlights:
Strongest Gross Margins: Weedmaps (94%)
Strongest 2022e EBITDA Margins: ZoomInfo (38%)
Strongest 2021-2023 Projected Revenue CAGR: Sea Limited (64%)
Strongest 2022e Rule of 40 Score: ZoomInfo (71)
Strongest JC Score: Weedmaps (23.79)
Weakest Gross Margins: Amazon (24%)
Weakest 2022e EBITDA Margins: Grab (-22%)
Weakest 2021-2023 Projected Revenue CAGR: eBay (1%)
Weakest 2022e Rule of 40 Score: Chegg (10)
Weakest JC Score: Amazon (2.41)
Scatter Plot Trendline Error Percentage:
“Undervalued”:
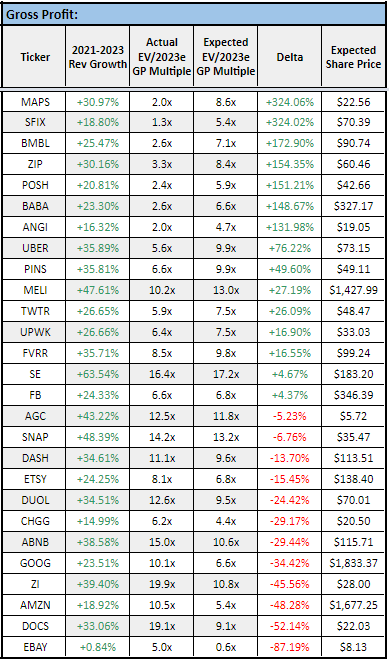
Gross Profit: Weedmaps (324% Upside)
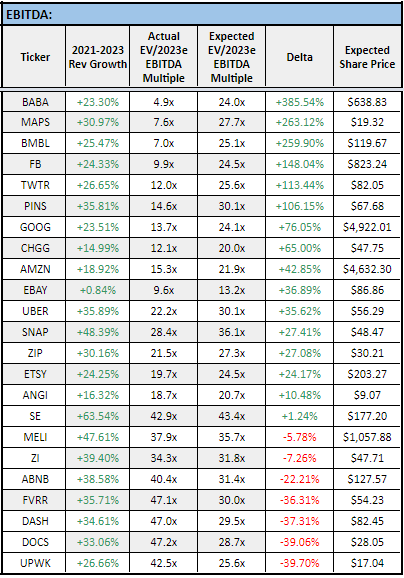
EBITDA: Alibaba (385% Upside)
“Overvalued”:
Gross Profit: Doximity (-52% Downside)
EBITDA: Upwork (-40% Downside)
Full Data:
Gross Profit:
EBITDA:
My Take
Some of these asset light marketplaces have really interested me as of late. Etsy and Fiverr stick out to me the most. As a former SSPK holder, Weedmaps still not finding a bid while having impressive fundamentals to rest on is quite a tough scene.
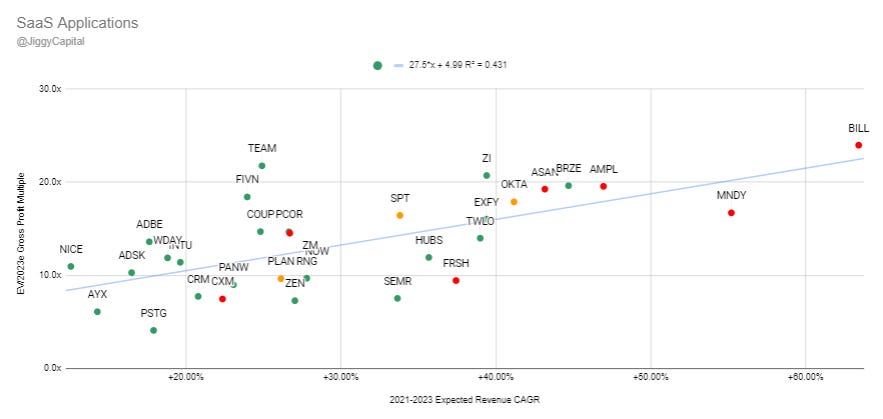
SaaS Applications
Group: Adobe (ADBE), Autodesk (ADSK), Amplitude (AMPL), Asana (ASAN), Alteryx (AYX), Bill.com (BILL), Braze (BRZE), Coupa (COUP), Salesforce (CRM), Sprinklr (CXM), Expensify (EXFY), Five9 (FIVN), Freshworks (FRSH), HubSpot (HUBS), Intuit (INTU), Monday.com (MNDY), Nice (NICE), ServiceNow (NOW), Okta (OKTA), Palo Alto Networks (PANW), Procore (PCOR), Anaplan (PLAN), Pure Storage (PSTG), RingCentral (RNG), Semrush (SEMR), Sprout Social (SPT), Atlassian (TEAM), Twilio (TWLO), Workday (WDAY), Zendesk (ZEN), ZoomInfo (ZI), Zoom Video (ZM)
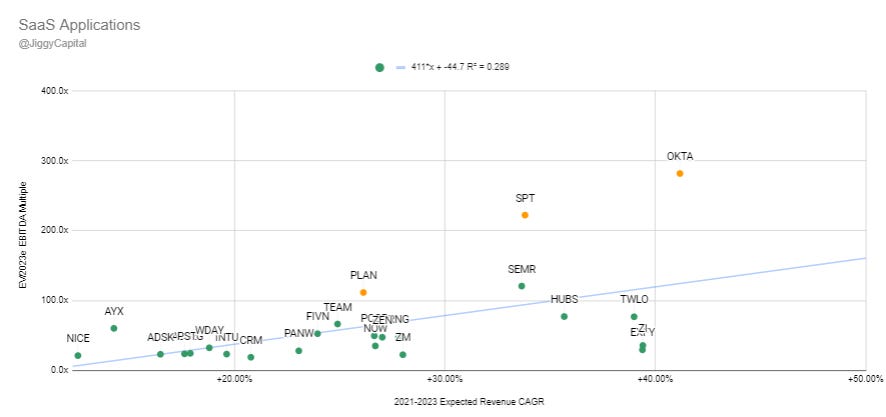
2021-2023 Revenue CAGR vs EV/2023 Gross Profit Multiple:
2021-2023 Revenue CAGR vs EV/2023 EBITDA Multiple:
Sector Stats:
Median Gross Margins: 77%
Median 2022e EBITDA Margin: 12%
Median 2021-2023 Projected Revenue CAGR: 27%
Median 2022e Rule of 40 Score: 37
Median JC Score: 3.41
Median EV/2023e GP Multiple: 13x
Median EV/2023e EBITDA Multiple: 42x
Sector Highlights:
Strongest Gross Margins: Autodesk (92%)
Strongest 2022e EBITDA Margins: Adobe (41%)
Strongest 2021-2023 Projected Revenue CAGR: Bill.com (63%)
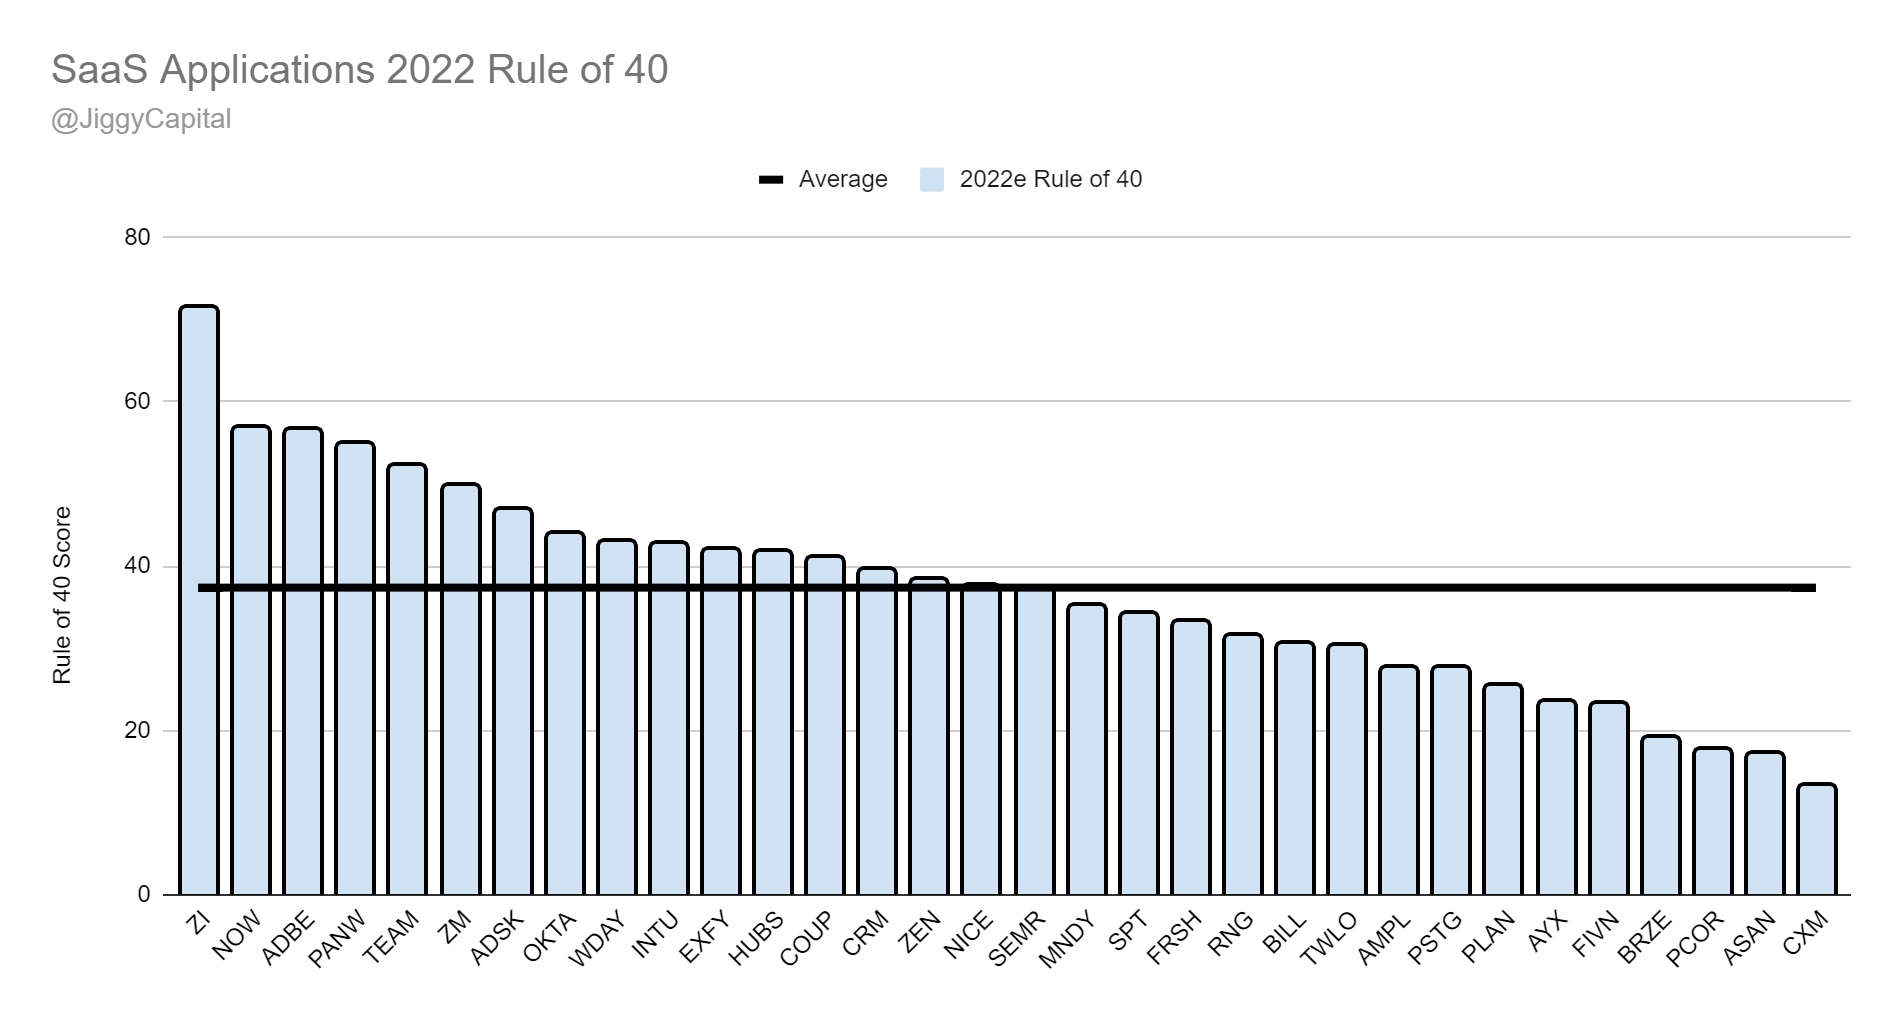
Strongest 2022e Rule of 40 Score: ZoomInfo (71)
Strongest JC Score: Pure Storage (6.91)
Weakest Gross Margins: Twilio (54%)
Weakest 2022e EBITDA Margins: Asana (-38%)
Weakest 2021-2023 Projected Revenue CAGR: Nice (13%)
Weakest 2022e Rule of 40 Score: Sprinklr (13)
Weakest JC Score: Asana (0.91)
Scatter Plot Trendline Error Percentage:
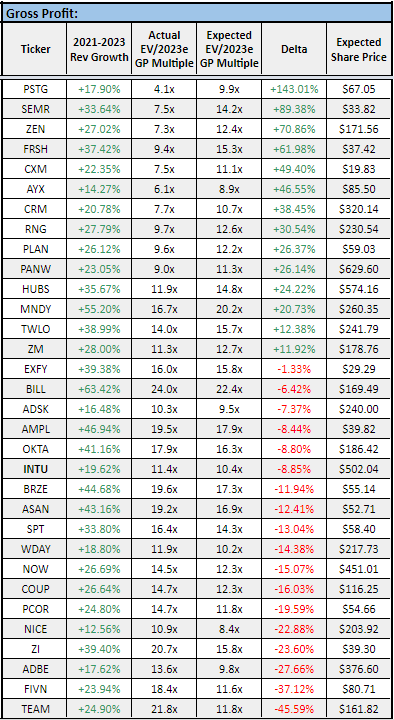
“Undervalued”:
Gross Profit: Pure Storage (143% Upside)
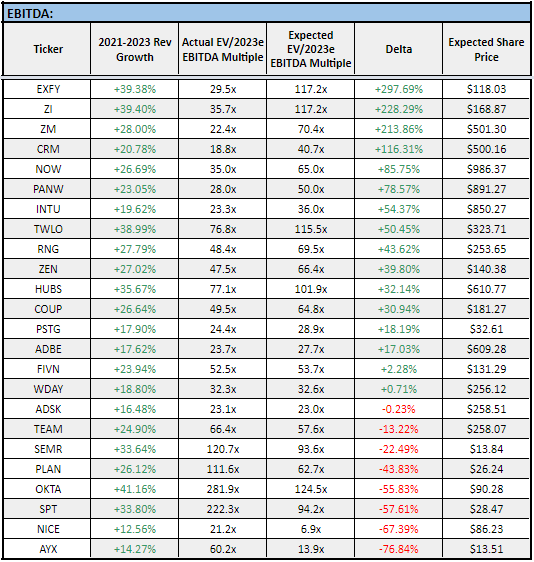
EBITDA: Expensify (298% Upside)
“Overvalued”:
Gross Profit: Atlassian (-46% Downside)
EBITDA: Alteryx (-77% Downside)
Full Data:
Gross Profit:
EBITDA:
My Take
An addition to the group of sectors looked at, SaaS Apps are filled with exciting, asset light, high margin, fast growing software companies like the cloud infrastructure group, but one would argue the “mission critical” factor with many of these companies is much less. Expensify has been catching my attention lately as a very profitable small cap in an area that resonates (I hate SAP Concur with a passion).
I’m not sure why I don’t own Adobe…
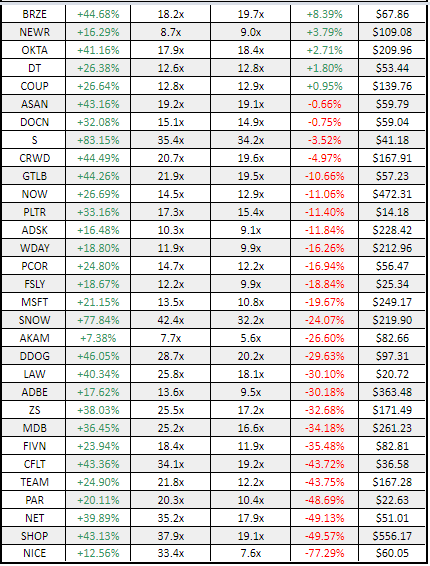
Software
Group: Adobe (ADBE), Autodesk (ADSK), Akamai (AKAM), Amplitude (AMPL), Asana (ASAN), Alteryx (AYX), Couchbase (BASE), Bigcommerce (BIGC), Bill.com (BILL), Braze (BRZE), Confluent (CFLT), Coupa (COUP), Salesforce (CRM), Crowdstrike (CRWD), Sprinklr (CXM), Datadog (DDOG), DigitalOcean (DOCN), Dynatrace (DT), Elastic (ESTC), Expensify (EXFY), Five9 (FIVN), ForgeRock (FORG), JFrog (FROG), Freshworks (FRSH), Fastly (FSLY), Alphabet (GOOG), Gitlab (GTLB), HubSpot (HUBS), CS Disco (LAW), Lightspeed (LSPD), MongoDB (MDB), Monday.com (MNDY), Microsoft (MSFT), Cloudflare (NET), New Relic (NEWR), Nice (NICE), ServiceNow (NOW), Okta (OTKA), Olo (OLO), Palo Alto Networks (PANW), Par (PAR), Procore (PCOR), Pagerduty (PD), Palantir (PLTR), RingCentral (RNG), Riskified (RSKD), SentinelOne (S), Semrush (SEMR), Shopify (SHOP), Snowflake (SNOW), Splunk (SPLK), Sprout Social (SPT), Squarespace (SQSP), Sumo Logic (SUMO), Taskus (TASK), Atlassian (TEAM), Twilio (TWLO), Vtex (VTEX), Workday (WDAY), Wix.com (WIX), Zendesk (ZEN), ZoomInfo (ZI), Zoom Video (ZM), Zscaler (ZS)
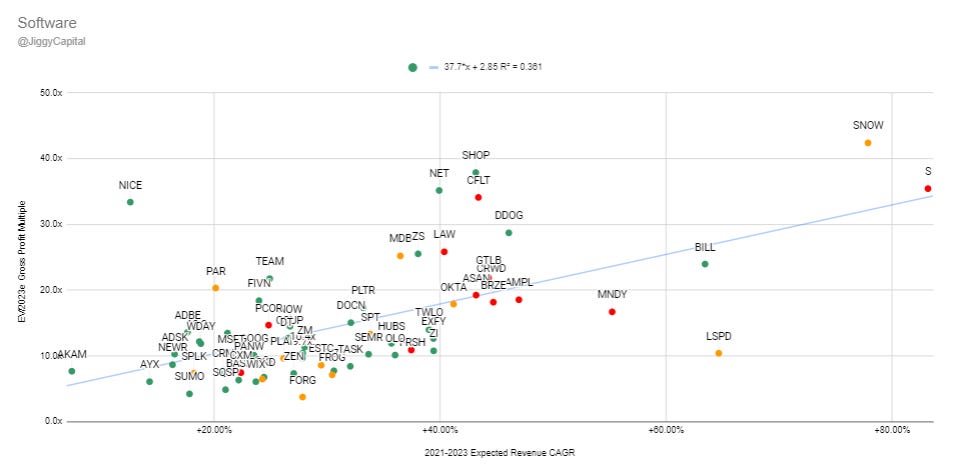
2021-2023 Revenue CAGR vs EV/2023 Gross Profit Multiple:
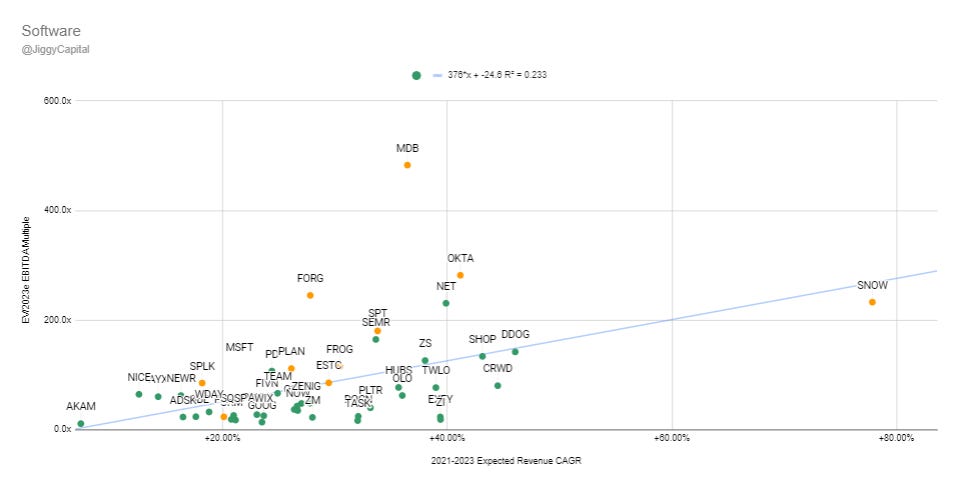
2021-2023 Revenue CAGR vs EV/2023 EBITDA Multiple:
Sector Stats:
Median Gross Margins: 76%
Median 2022e EBITDA Margin: 8%
Median 2021-2023 Projected Revenue CAGR: 28%
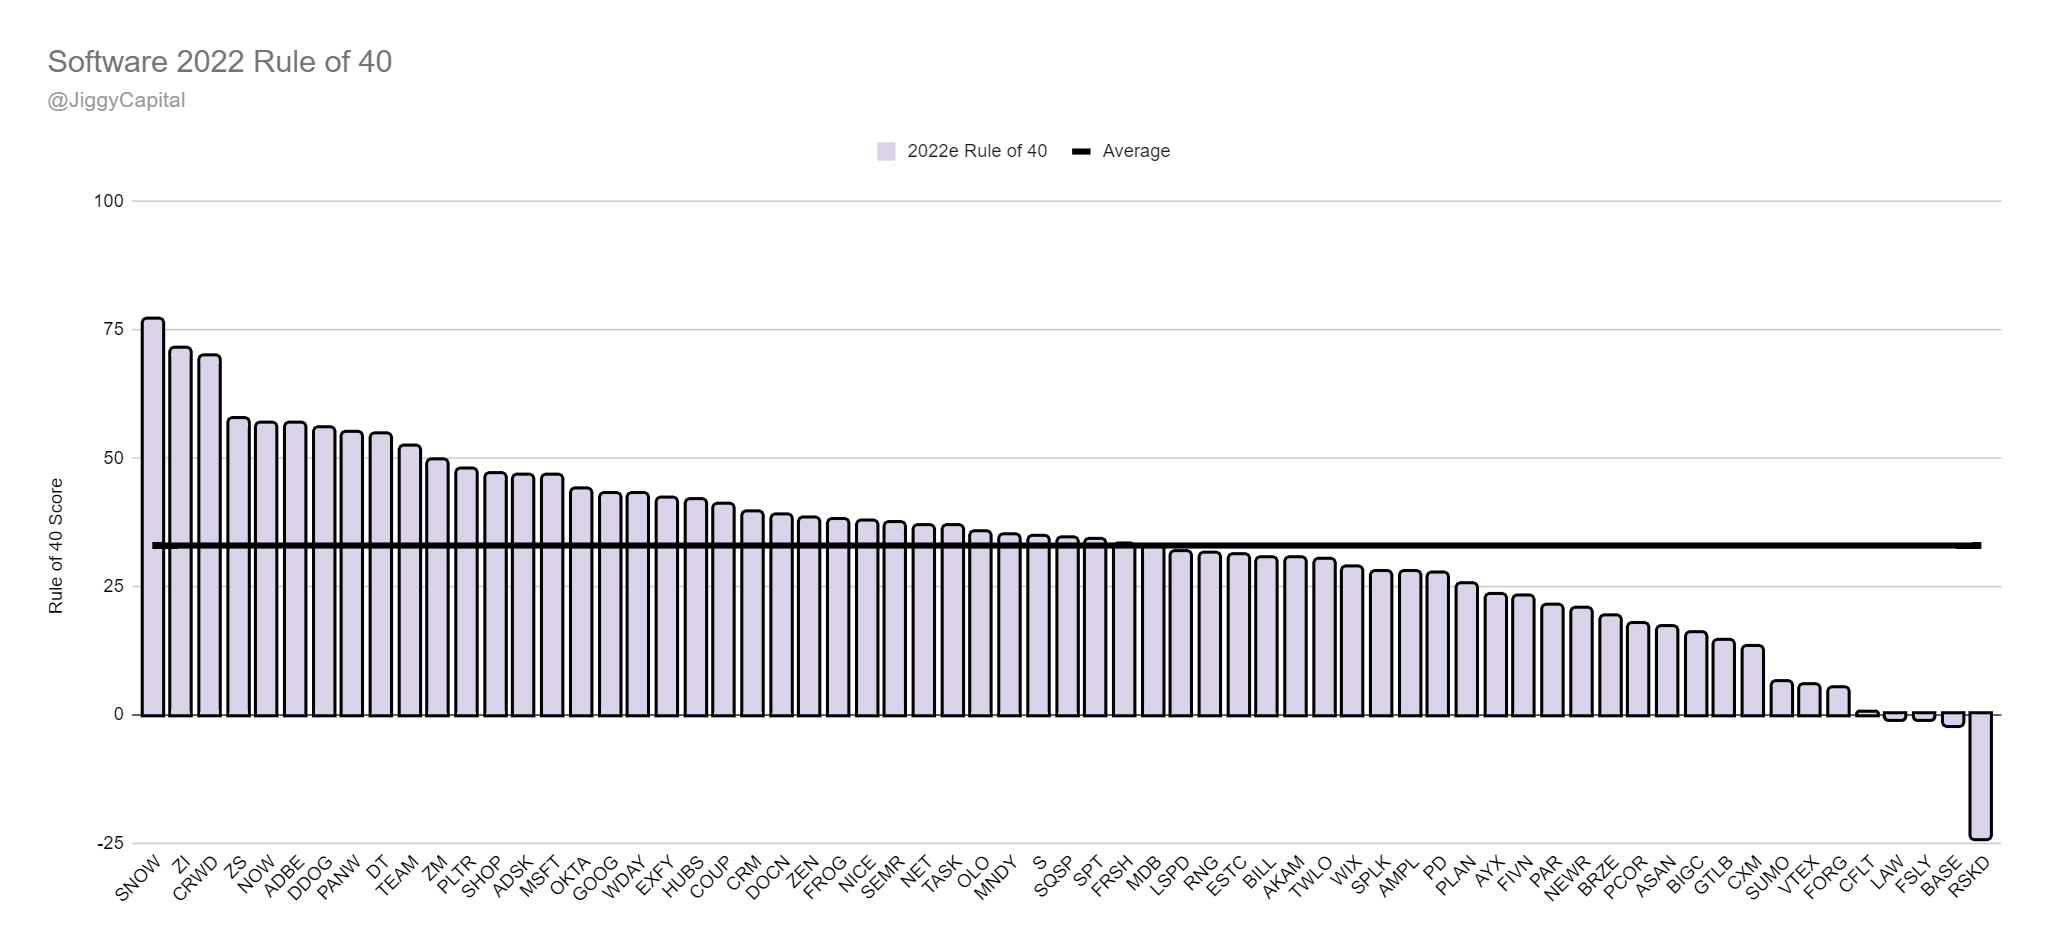
Median 2022e Rule of 40 Score: 34
Median JC Score: 2.66
Median EV/2023e GP Multiple: 12x
Median EV/2023e EBITDA Multiple: 56x
Sector Highlights:
Strongest Gross Margins: Autodesk (92%)
Strongest 2022e EBITDA Margins: Adobe (41%)
Strongest 2021-2023 Projected Revenue CAGR: SentinelOne (83%)
Strongest 2022e Rule of 40 Score: Snowflake (77)
Strongest JC Score: Squarespace (7.04)
Weakest Gross Margins: Par (24%)
Weakest 2022e EBITDA Margins: SentinelOne (-38%)
Weakest 2021-2023 Projected Revenue CAGR: Akamai (7%)
Weakest 2022e Rule of 40 Score: Riskified (-24)
Weakest JC Score: Vtex (0.56)
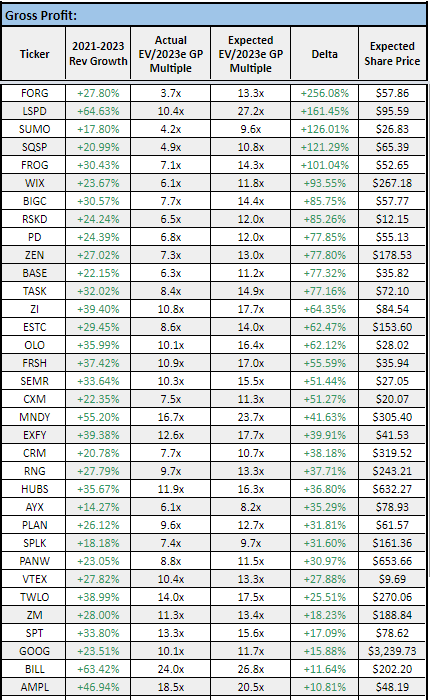
Scatter Plot Trendline Error Percentage:
“Undervalued”:
Gross Profit: ForgeRock (256% Upside)
EBITDA: ZoomInfo (565% Upside)
“Overvalued”:
Gross Profit: Nice (-77% Downside)
EBITDA: MongoDB (-77% Downside)
Full Data:
Gross Profit:
EBITDA:
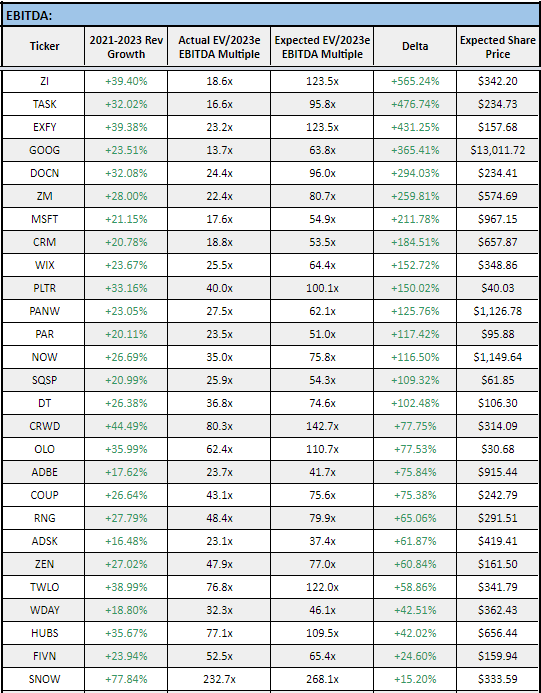
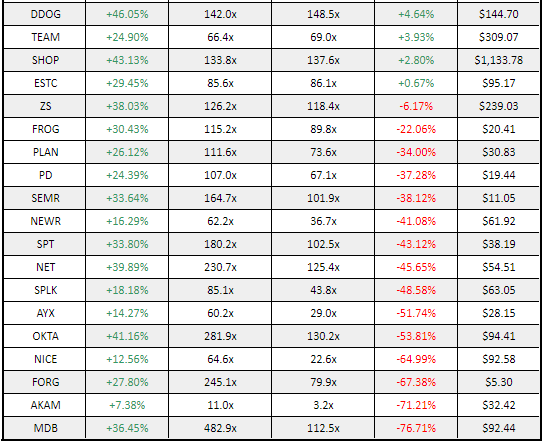
My Take
It’s quite amazing the premium some software companies trade at and find strong bid support, but others trading sub 10x GP that have zero bid support and continue making new lows.
This is the area I fish the most as ~90% of my portfolio are software companies. Personally, some these valuations are starting to look like deals when considering other factors.
Conclusion
I hope this was an enjoyable read and provided that extra inspiration to start digging on a company you’ve been debating digging into. I hope to be adding more and more data/value to each of these editions! Feedback is
AdTech: Magnite
Big Tech: Alphabet
Cloud Infrastructure: Twilio
eCommerce: Mercadolibre
Fintech: Shift4 Payments
Gaming: Take-Two Interactive
Platform: Pinterest
SaaS Applications: Adobe
Software: ZoomInfo
I hope to be adding more and more data/value to each of these editions! Feedback is more than welcome, and thank you to the people who have reached out via Twitter DMs or mentions. My last edition from Q4 21 is what got me interested in dLocal which I think is an incredibly exciting company (although I’m holding the bag on it), and I get a great deal of benefit creating these newsletters as well.
I remind people this is just one small piece of the puzzle when making an overall investing decision for myself!
- Sean