

Q1 2022: Operating Expense Analysis
Q1 2022: Operating Expense Analysis
The Jiggy Capital Newsletter #13

Overview
Here we are with v2 of my favorite newsletter topic I’ve previously done: Operating Expense Analysis!! Last years version is found here.
I think this has the most useful information of any of the subjects I do, but I’m also biased in that I’m a big believer in numbers telling a great story. The goal for this time around is to make the data presentation more concise and easy to digest, as the feedback I got on last summers version was it was great data but hard to follow through.
My original goal from last years version was to identify companies who dump money into R&D and how that relates to their other category spends like SG&A, and the growth of all of these categories relative to each other (including gross profit growth). In this version I’ve now expanded to look at gross margin trends as well as stock based compensation levels for 2021 across this company dataset.
Before we get started, I will make the same point I did last year: I have absolutely zero clue how much of the R&D spend is toward actual innovation versus defensive R&D spend to keep up.
At the end of the day this is the best I can do, but I do acknowledge this is something worth considering as you make your way through this write-up.
A great article on this topic that I also linked in last years version.
All of this data comes from Koyfin! My deepest apologies if something is off, this was way too much manual data entry haha…
UPDATE RIGHT BEFORE POSTING: Koyfin uses both USD and Yuan inside their data so please disregard anything with BABA and JD in here. I’m too far deep to adjust all of it now but it’s a minimal impact. My apologies!!
Table of Contents
Companies Included
Terminology
R&D Expense vs Gross Profit
SG&A Expense vs Gross Profit
R&D Expense vs SG&A Expense
Gross Margins
Stock Based Compensation
Conclusion
Author’s Note/Housekeeping
Companies Included
Compared to last years group of ~75, I've greatly expanded the data pool to now 180 companies. Below are the companies included broken down by industry in order of ticker.
Big Tech: Apple, Amazon, Alphabet, Meta, Microsoft, Tesla
eCommerce: Alibaba, Chewy, Coupang, eBay, Etsy, Farfetch, JD, Jumia, Mercadolibre, Poshmark, TheRealReal, Revolve, Sea Limited, ThredUp
Fintech/Payments: Affirm, Avalara, Blend Labs, Coinbase, dLocal, Flywire, Shift4, Global-E, Lending Club, Lightspeed, Mastercard, Marqeta, Nu Bank, Nuvei, Paypal, Square, Toast, Visa
Internet: Airbnb, Applovin, Chegg, DoorDash, DraftKings, Doximity, Duolingo, Evolution Gaming, Fiverr, Genius Sports, Weedmaps, Magnite, Nasdaq, Netflix, Pinterest, Pubmatic, Roblox, Snap, TheTradeDesk, Twitter, Upwork, Ziprecruiter
Software: Adobe, Autodesk, Amplitude, Asana, Couchbase, Bigcommerce, Bill.com, Blackline, Braze, Ceridian, Confluent, Coupa, Salesforce, Crowdstrike, Sprinklr, Datadog, Docusign, Digital Ocean, Dynatrace, Elastic, Expensify, Five9, ForgeRock, JFrog, Freshworks, Fastly, Gitlab, Hashicorp, Hubspot, Informatica, Intuit, Samsara, CS Disco, Lightspeed, MongoDB, Monday.com, Cloudflare, Nice, Newrelic, ServiceNow, Okta, Olo, Palo Alto Networks, UiPath, Paycom, Paychex, Procore, Paylocity, Pagerduty, Anaplan, Purestorage, PowerSchools, Qualys, RingCentral, Rapid7, SentinelOne, Semrush, Shopify, Smartsheet, Snowflake, Splunk, Sprout Social, Squarespace, Teradata, Atlassian, Tenable, Twilio, Tyler Technologies, Veeva, Workday, Qualtrics, Zebra, Zendesk, ZoomInfo, Zoom, Zscaler
Semiconductors: AMD, Analog Devices, Applied Materials, ASML, Broadcom, Cadence, Globalfoundries, Intel, KLA, Lam Research, Marvell, Micron, Nvidia, NXP, On, Qualcomm, Skyworks, Synopsys, Taiwan Semi, Texas Instruments
Terminology
R&D - Research & Development
GP - Gross Profit
GM - Gross Margin
SG&A - Sales, General & Administrative
CAGR - Compound Annual Growth Rate
OpEx - Operation Expenses (R&D + SG&A)
SBC - Stock Based Compensation
R&D Expense vs Gross Profit
The purpose of this first section is to take a look at company’s R&D spend versus their gross profit growth and as an overall percentage. Like I said in the introduction, the companies that prioritize investment into R&D are most likely to be the ones who create new revenue streams as time goes on or just greatly improve their product.
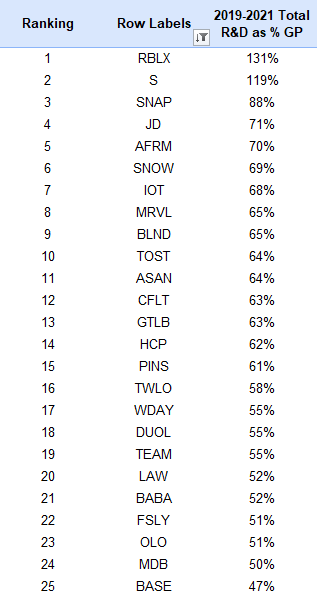
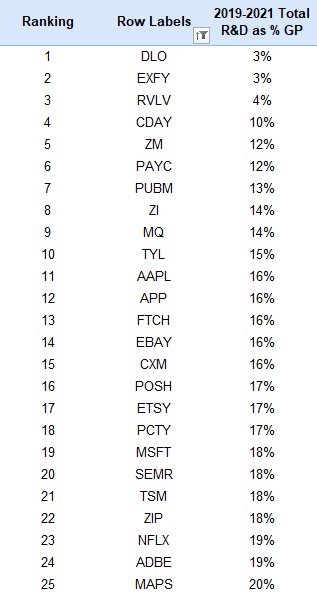
First, lets look at the top 25 highest and lowest Total R&D expense as a % of Gross Profit over 2019-2021:
Takeaway
For any company to spend more on R&D than the gross profit they produce over a three year period is quite impressive to me - only Roblox and SentinelOne have that title from this group! I think all in all the top 25 R&D spenders group over the last three years have something meaningful to show for those investments in product development. JD.com and Marvell surprised me the most showing up in that group.
For the low R&D spender group, this is a mix of lean software companies or more mature companies. It’s mind boggling how dLocal spends so little on R&D and to produce the growth they have still…
Another calculation that gives a great snapshot on how a company values R&D expenses as it grows is the change as a % of Gross Profit over time. This will be done looking at the CAGR of R&D expense as % GP.
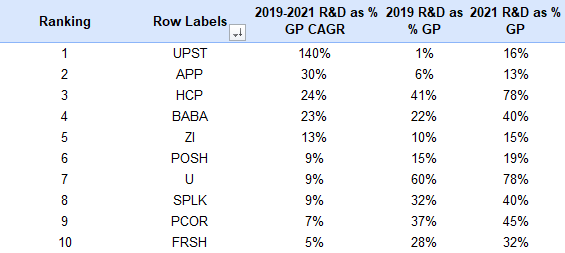
This table shows the Top 10 increasing R&D expense as % of GP CAGR over 2018-2020 with a small caveat of their 2018 R&D spend as % of GP starting above 10% to remove law of small numbers:
Takeaway
Upstart is the obvious takeaway here as they’ve gone from spending basically nothing on R&D to now spending 16% of gross profits on R&D.
I’d argue the most impressive one on here is HCP due to already starting at R&D spend being 41% of GP in 2019, and increasing to 78% of GP in 2021.
Now lets get into a full picture of a company’s R&D spend.
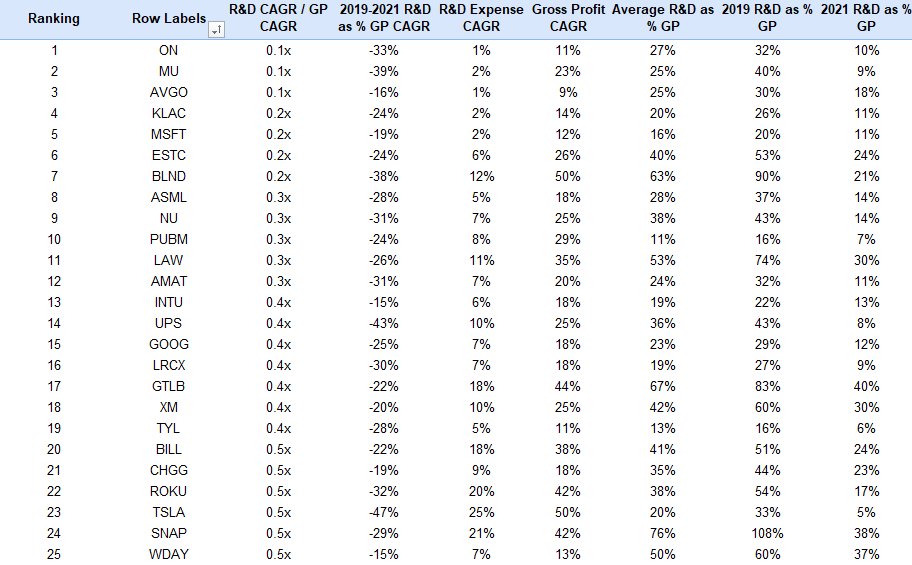
This table has quite a bit going on but in the first column we are comparing a company’s R&D Expense CAGR divided by their GP CAGR over the past three years. This shows if a companies R&D spend growth is outpacing their GP growth or at least keeping up with it.
This table is sorted by Top 25 highest and lowest R&D Expense CAGR / Gross Profit CAGR:

Takeaway
JD’s investment into R&D is pretty serious as they’ve outpaced their gross profit growth by 6x. I’m not familiar with JD enough to understand what was driving this.
In general, a combination of R&D spend outpacing GP growth + positive R&D as % GP CAGR is a strong pairing in my view.
Taking a look at the flipside in the Top 25 lowest R&D Expense CAGR / Gross Profit CAGR multiples:
Takeaway
The biggest takeaway I have from the R&D spenders that had GP growth greatly outpace it: semiconductor companies have let their R&D spend stay stagnant while their gross profits blew up over the last three years due to a serious shift in semiconductor demand.
Elastic has no business being on that list imo and Bill.com at least makes sense since they had some big M&A that greatly accelerated their GP growth.
SG&A Expenses vs Gross Profit
With this section I’ll look at companies in a way that questions: are they maybe subsidizing their growth with an inflated SG&A expense or even outpacing it? What happens when the promos or marketing spend declines, does the company still grow and retain customers?
First, lets look at the top 25 lowest Total SG&A Expense Spend as a % of Gross Profit over 2019-2021:
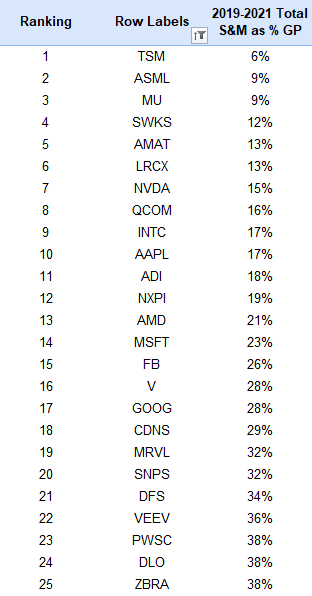
Takeaway
9 of the top 10 are semiconductor companies, and 15 of the total 25 companies! These companies have obviously shown they don’t need to make serious investment into SG&A to have their products in the semi ecosystem sell like hot cakes. The rest of the list are mostly mature companies.
And again, the flipside for the 25 highest Total SG&A Expense Spend as a % of Gross Profit over 2019-2021:
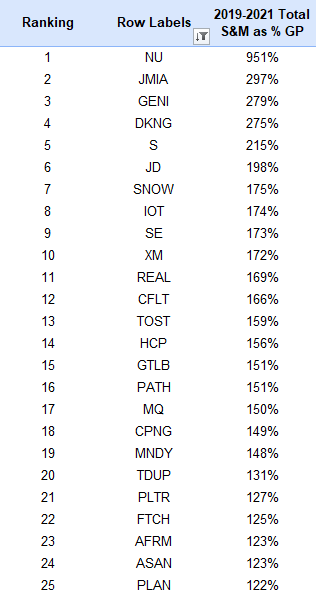
Takeaway
It makes me quite sad seeing SNOW as such a foul offender of large SG&A spend. The others on the last don’t surprise me too much, but wow is this overall not sustainable to be spending over 100% of GP on SG&A…
Now doing something similar looking at if SG&A expenses outpaced a company’s GP growth. This will be done by looking at SG&A Expense CAGR / Gross Profit CAGR, and you want this multiple to be at least <1.0x. The top 25 lowest:
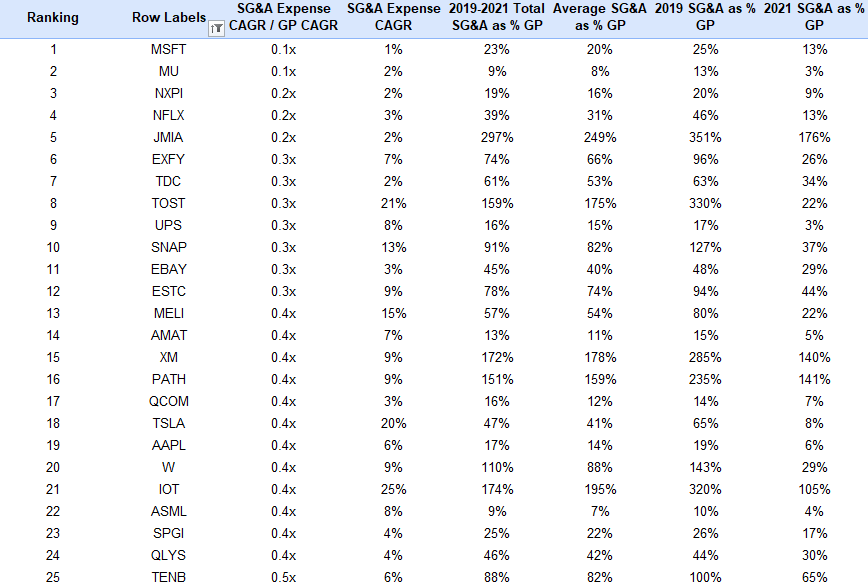
Takeaway
It makes sense that Semiconductor companies would dominate this list after I laid out their scenario in the last section. Microsoft also showing the strength of the best software distribution channel having SG&A expenses stay flat (1%) over the last three years but the business absolutely killing it.
My biggest surprise is seeing Snap Inc on here so high up!
Most of these are attributable to a flat SG&A expense CAGR, whether that’s due to an already heightened SG&A spend prior to 2019 or not putting further investment in, and still having great GP growth.
Here we have the top 25 foul offenders of companies who had their SG&A spend greatly outpace their GP growth:
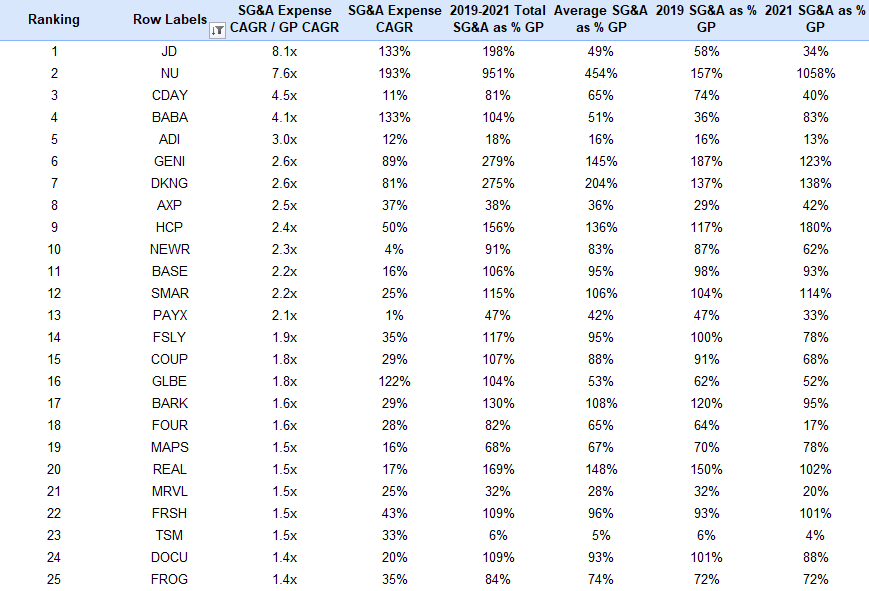
Takeaway
This is quite the interesting group of companies as I can’t really place a similar trait between the 25, other than they’ve increased spend on SG&A evidently. At first I was surprised to see TSM show up, but then you realize how small a % their SG&A spend is going from 6% of GP in 2019 to 4% of GP in 2021.
R&D Expenses vs SG&A Expenses
The purpose of this section is to look at what OpEx category has had the larger investment, or has grown faster versus the other over the last three years. IMO, a company that has SG&A spend CAGR outpacing their R&D spend CAGR is at least a yellow flag unless it’s a mature company, there’s been immense M&A, or they went public over that time period.
Here are the top 10 sorted by highest Total R&D Expense / Total SG&A Expense from 2019-2021, since you want this multiple to be as much >1.0x as possible:
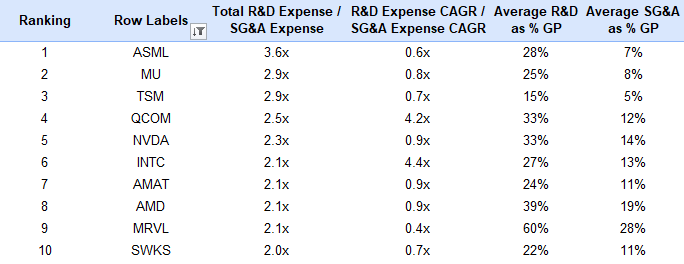
Takeaway
LOL, all 10 companies are semiconductor companies. This is probably going to be my biggest takeaway: if you like R&D spend and hate SG&A spend, get long semiconductors haha.
But honestly this is super impressive if they can keep this up and reinforces the competitive advantages each of them have in the ecosystem. ASML having the largest multiple is by no accident given being probably the most strategically important company in the world.
Now the top 10 sorted by lowest Total R&D Expense / Total SG&A Expense:
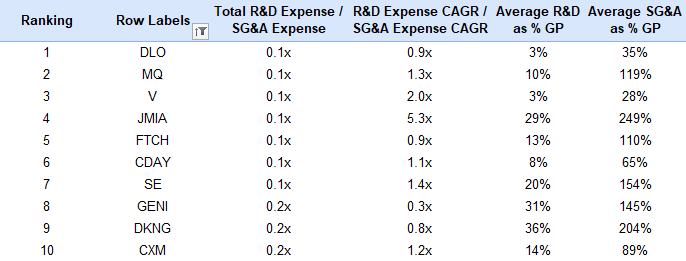
Takeaway
These are companies who have basically over the last 3 years spend $1 on R&D for every $10 they spent on SG&A…not great!
Looking at some of the larger numbers, the biggest offenders here are MQ, JMIA, SE, GENI, DKNG. I wouldn’t be alarmed by V on here since it’s such a mature company that % for R&D is a helluva lot larger than it seems.
Since we got a glimpse of the total OpEx category spend over the last three years and how they compare, now we will look at how fast each category grew, and which outpaced which.
Frist we will look at the top 10 companies who had their R&D expense spend greatly outpace the SG&A expense spend over the last three years:
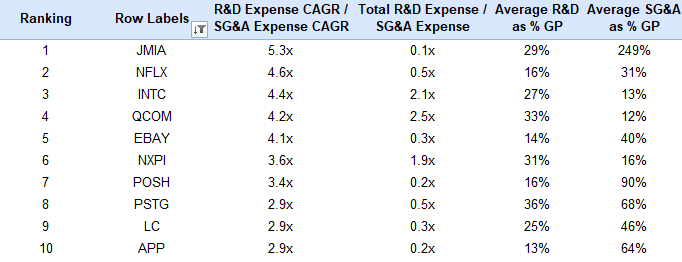
Takeaway
I almost think my Jumia numbers are wrong haha, but that’s because they’ve stayed basically stagnant over the last couple years. The rest are mostly semi companies (surprise). Can eBay just buy Poshmark already?
I’d be curious how Netflix longs feel about this noticeable uptick in R&D spend. I take it a majority of it is content development spend but I’m not close enough to the name.
The flipside of companies who had their SG&A spend greatly outpace their R&D spend over the last 3 years:
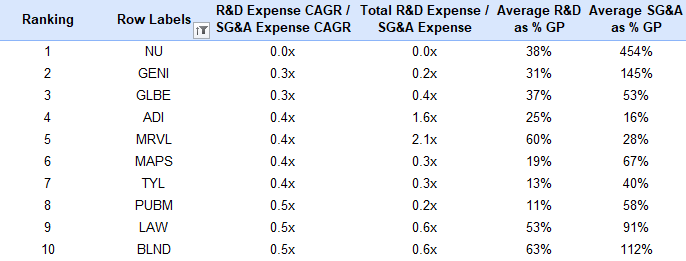
Takeaway
Nothing really sticks out here, Nu Bank looks a lot worse since they had a big vesting event when they went public. I hate seeing Tyler Technologies here as that’s at the tip top of my watchlist, but maybe a byproduct of GovTech since CS Disco also shows up.
Gross Margins
Here starts the new sections to this iteration. First we will be looking at companies who had their Gross Margins expand over the last three years:

Takeaway
I mean, how impressive is Tesla here? That kind of margin expansion for an auto company is just not normal and I’ve never been a bull (cause I’m an idiot). Toast’s improvement being impressive is really how you look at it since their margins were so pathetic for a software + payments company.
Micron is probably the second most impressive one on here since they are such an already mature company!
Top 25 companies with the largest gross margin erosion over the last three years:
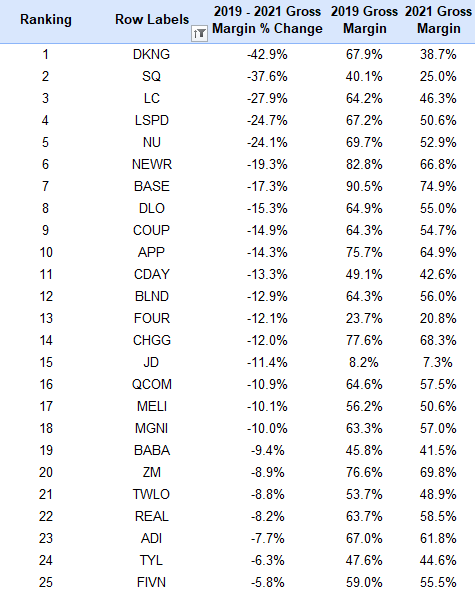
Takeaway
The underlying theme here is layering in payments in some which way, or in SQ’s case layering in Bitcoin revenue at basically no margin. Not sure the story behind New Relic and Ceridian but those stood out most to me. I’m also not a big fan of dLocal margins eroding as they’ve scaled outside of LATAM, but does make sense.
Stock Based Compensation
For our final analysis section, we have fintwit’s favorite topic of discussion: stock based compensation!! Is it an expense?? It it real?? Do you back it out of FCF or not?? Such a fun debate :)
Shown below are the top 25 highest offenders of 2021 stock based compensation as a % GP:
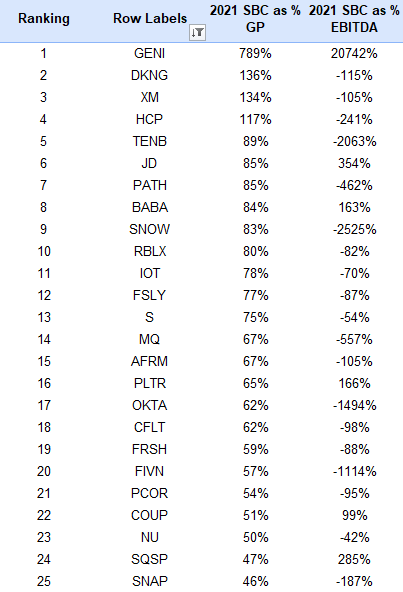
Takeaway
I wouldn’t call this the highest quality group of stocks, but some like Freshworks showing up can be attributed to recently going public which was a large vesting event triggering higher than normal SBC expense. Companies like Five9 and Procore have no reason to be on this list.
REMEMBER - BABA and JD numbers are wrong - their real numbers are around 22% each.
Now I’m going to look at companies who might be profitable, but most of that profitability is being allocated to SBC. Below are the Top 25 companies with highest SBC as a % of EBITDA:
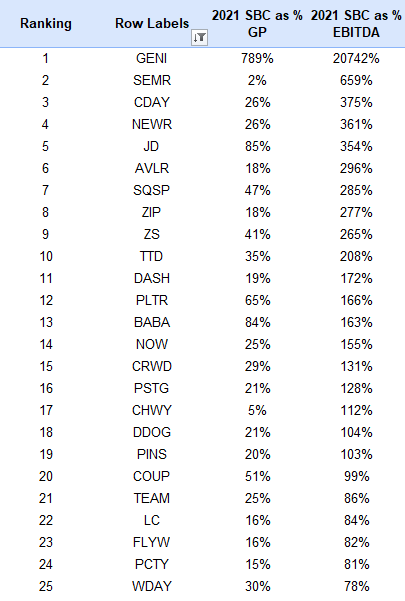
Takeaway
I wouldn’t make big conclusions from this table as SEMR looks quite terrible having SBC at 659% of their EBITDA, but then you realize SBC is only 2% of GP (they are barely profitable so extremely tiny denominator).
Hate seeing some of my favorites show up here like NOW, DDOG, TEAM but they aren’t a big offender. Biggest offender to me here (outside GENI of course) is SQSP.
Conclusion
Well, that was a lot of data that I hope was easier to digest than last time. I’m still a terrible writer but the good news is that the data used is found here (also found on my substack homepage).
This was an exercise I really learned a lot doing as the dataset was expanded quite a bit and more criteria was looked at. Here are my biggest takeaways:
iGaming companies have just brutal unit economics (surprise surprise)
Semiconductor companies are amazing capital allocators to me
Greater appreciation for what Telsa has pulled off over last three years
Software companies at large had steady margins over the last three years compared to other sectors looked at
Jumia is such a weird company and will be a case study however their story plays out
Some of this SG&A spending is just NOT sustainable and will be interesting to follow as some of these companies continue to incinerate cash
I would love feedback on how I can improve this edition for the future!
Author’s Note/Housekeeping
Thank you all for being patient with my cadence of substack write ups. As we’ve inched closer to the spring and a more reopened world, I’ve been much more busy on the weekends and work has taken up more time with travel.
I don’t anticipate this changing any time soon as I’m actually making a big career change going from selling flexible packaging (think shredded cheese bags) to selling software at a public company. It’s crazy to think how much of an impact investing and fintwit has made on my life, with this career change being the largest example. Zero chance this happens unless I gained the interest I did in software companies while being on Twitter.
My goal is to release my Portfolio Update and What I Learned a week from today, and the Earnings Recap Pt 2 as soon as I finish it! It’s kind of a mess for this second part since my portfolio has seen an insane amount of turnover this quarter as I fell in love with semiconductor companies and wasn’t afraid to let go of some of my GARP-y names for higher quality.
After my last post, I cleared 1,000 subscribers with quite a few people in the industry singing up for my newsletter. I’m extremely grateful for each one of you for deciding to read along my journey!
- Sean
Great analysis, but wondering about some of your calculations. With Roblox, how did you get to 131% of GP spent on R&D from 2019 - 2021? I calculate like 33%.